Health and Wellness App
Great news for those who want a customizable health and wellness app
As the only health and wellness app that includes environmental data, web and social activity, and a symptom log, you may learn more about yourself than has been possible before. See what impacts your productivity, mental health, and more.
The most powerful and easy to use health and wellness app for your daily life. Create your own journey in a digital format that captures your entire digital world. Easily see what keeps you strong, positive, and happy.
Live and learn with the Best Life app for Health and Wellness
Powered up with Alexa voice integration, weather data, your own daily symptom log, and a mood journal, Best Life simplifies hundreds of other tools to become your super app.
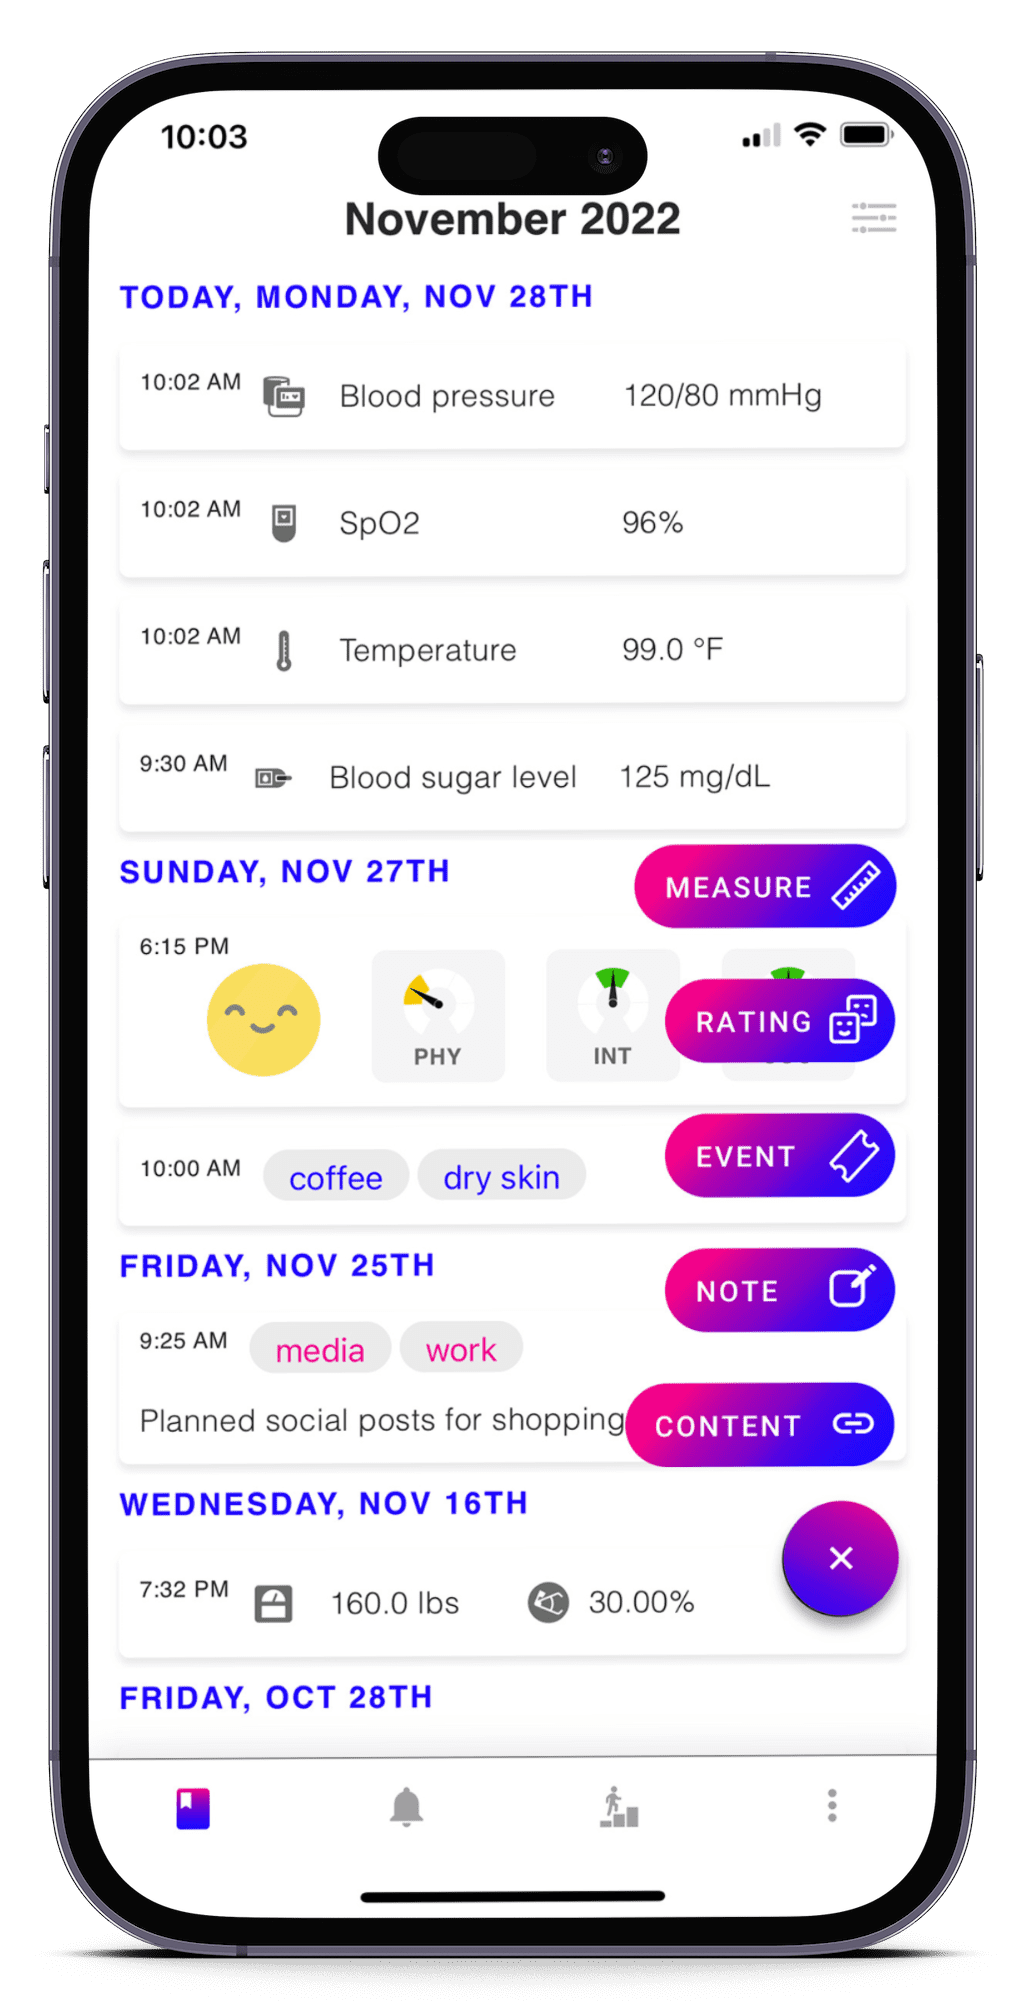
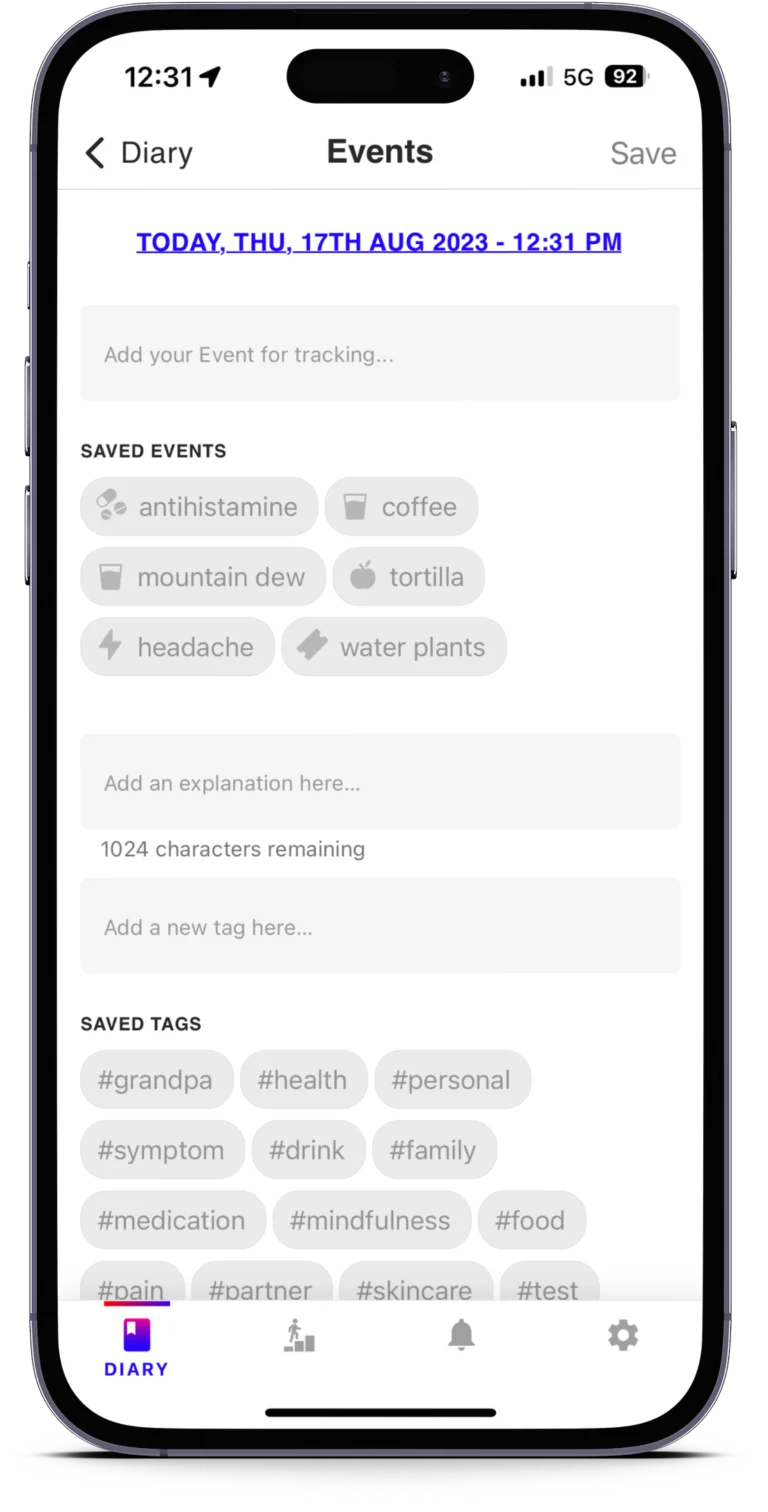
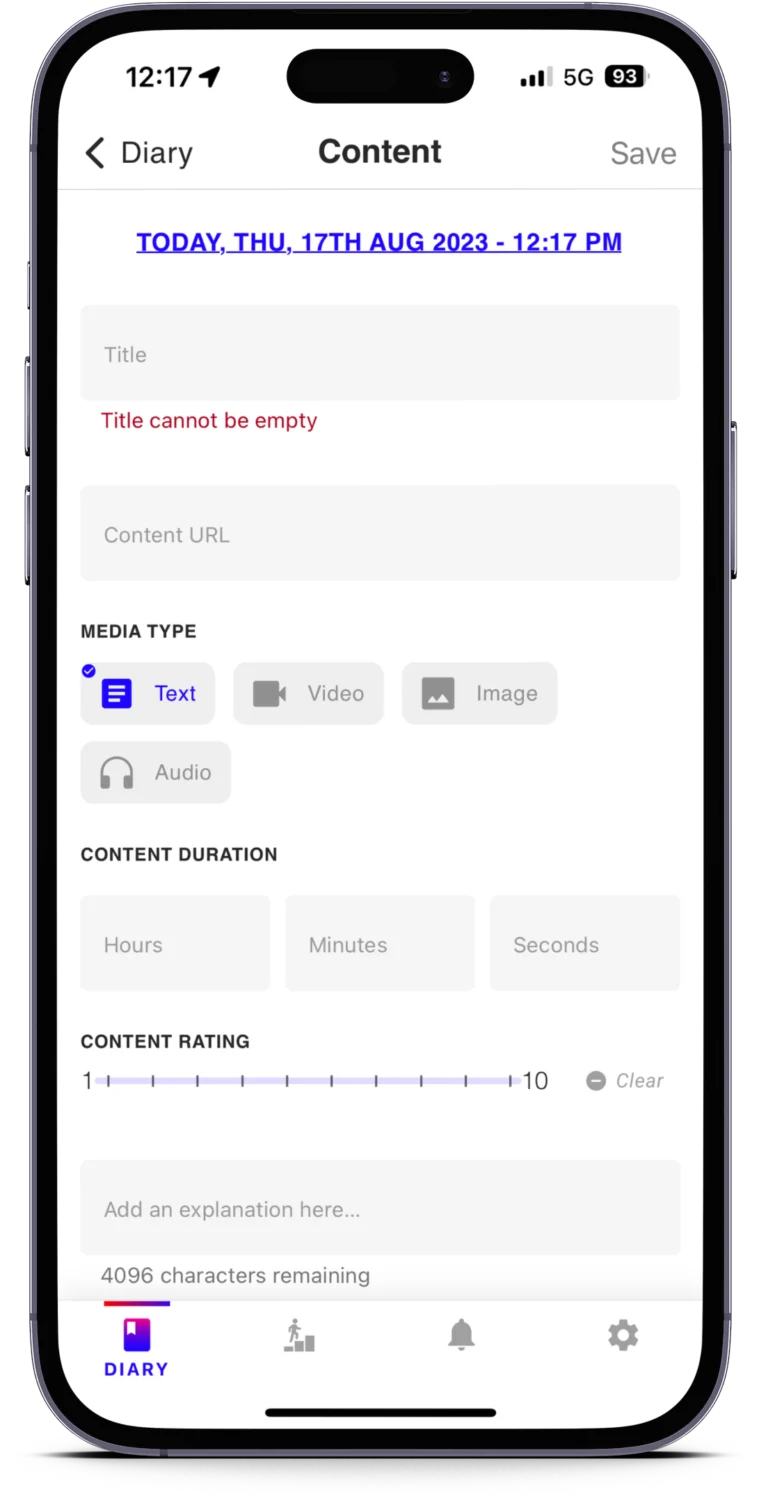
- Events. Best used for those slice-of-time moments like working on a hobby.
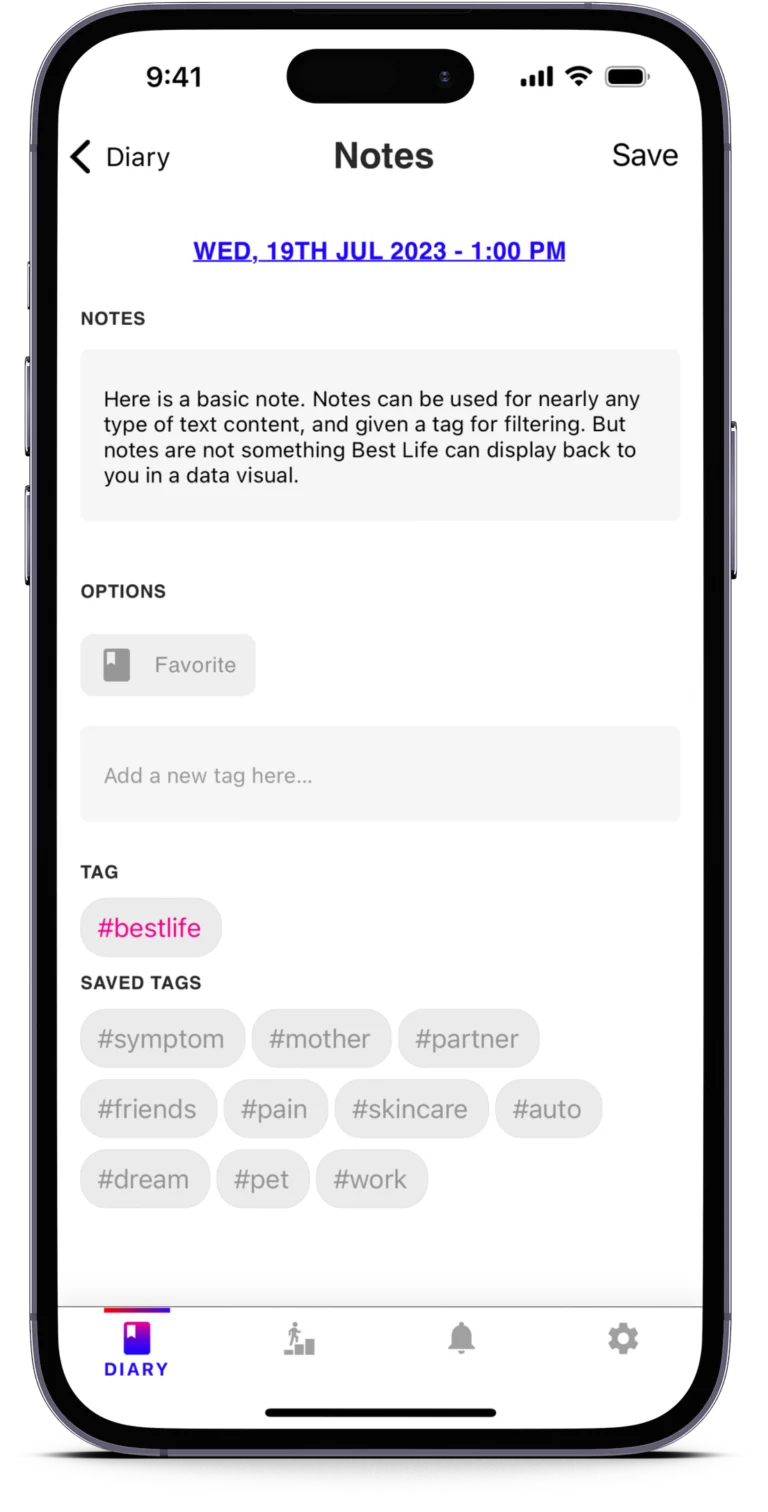
- Tags. For creating a category around Notes, Events, and more.
- Ratings. Capturing your mood and stress in a single motion.
Just two minutes of journaling a day reduces symptoms of depression and anxiety.
Take that time to work towards and achieve a better state of mind today.
Supporting data from these providers


Finally, a health and wellness app with flexibility
An easy to use journal with flexibility to be what you want it to be! Without interference, you can give yourself the space to just be present. This is not your typical note taking app. We don’t make you feel like you just joined a writing course when you’re trying to bullet journal out that thought.
More than a memo pad, you can plan your day according to local factors, your personal habits, measure your goals with real data, and understand your emotions with a science-backed mood tracker. Our highly customizable Event tracking feature lets you track everything from health to home maintenance and visualize the results with easy-to-understand graphs.
Track it all in one place
- Air elements
- Air particulate matter
- Air quality index
- Temperature
- Steps
- Resting heart rate
- Blood pressure
- Journal + notes
- Diet + nutrition
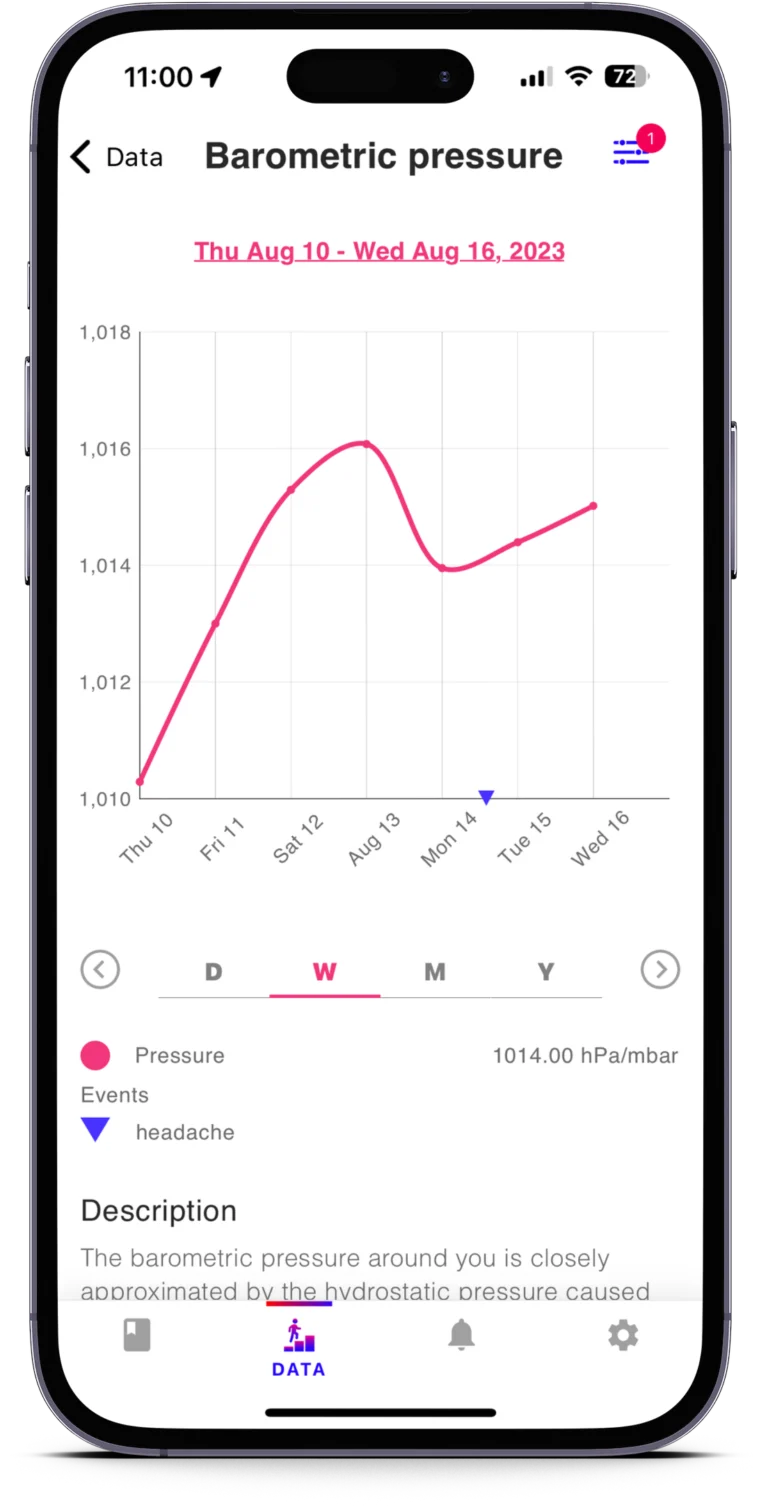
- Barometric pressure
- Carbon monoxide
- Wind speed + direction
- Humidity
- Pulse oxygen saturation
- Blood sugar levels
- Amazon shopping
- General symptoms
- Ozone
- Places traveled
- Pollen
- Web activity
- Body weight
- Sleep duration + quality
- Mood + stress ratings
- ...basically everything!
Visualize your habits
It is easy to get lost in the daily grind. Take as much or as little time as you like to log your day. Build your own virtual space to focus on you, with measurable benefits.
Determine trends
Our Best Life mobile app and data dashboard is the only data aggregation software available to include all data providers you use, giving you the big picture.
Make strategic decisions
Easily share reliable, accurate data from your symptom logs, health monitors, and mood tracker to health providers for mental and physical check-ins, when you choose.
Improve accountability and motivation with a health and wellness app.
Cope with emotional turmoil, like depression. Reduce the impact of negative responses to anxiety. Prioritize things in your life easier. Give yourself a chance to be mindful and self-advocating.
Symptom Tracker Hacks: 9 Tips to Get the Most Out of Your Health Data
The only health and wellness mobile app with all your environmental factors.
Get pollen data based on where you are—even when you travel. You’ll be able to easily track and compare across your health data from day-to-day. Tree, weed, and grass pollen count data plus air quality, ozone, air particulate matter and more.
This is the best health journal app that gives you the big picture of your digital life, daily habits, mental, and physical health.
Here's why you should be using an health tracker
Still need some convincing? Here are four great reasons to start using Best Life as your health tracker app today!
Identify triggers
Identify triggers
Gain more control
Gain more control
Improve your well-being
Improve your well-being
Stay in the know
Stay in the know
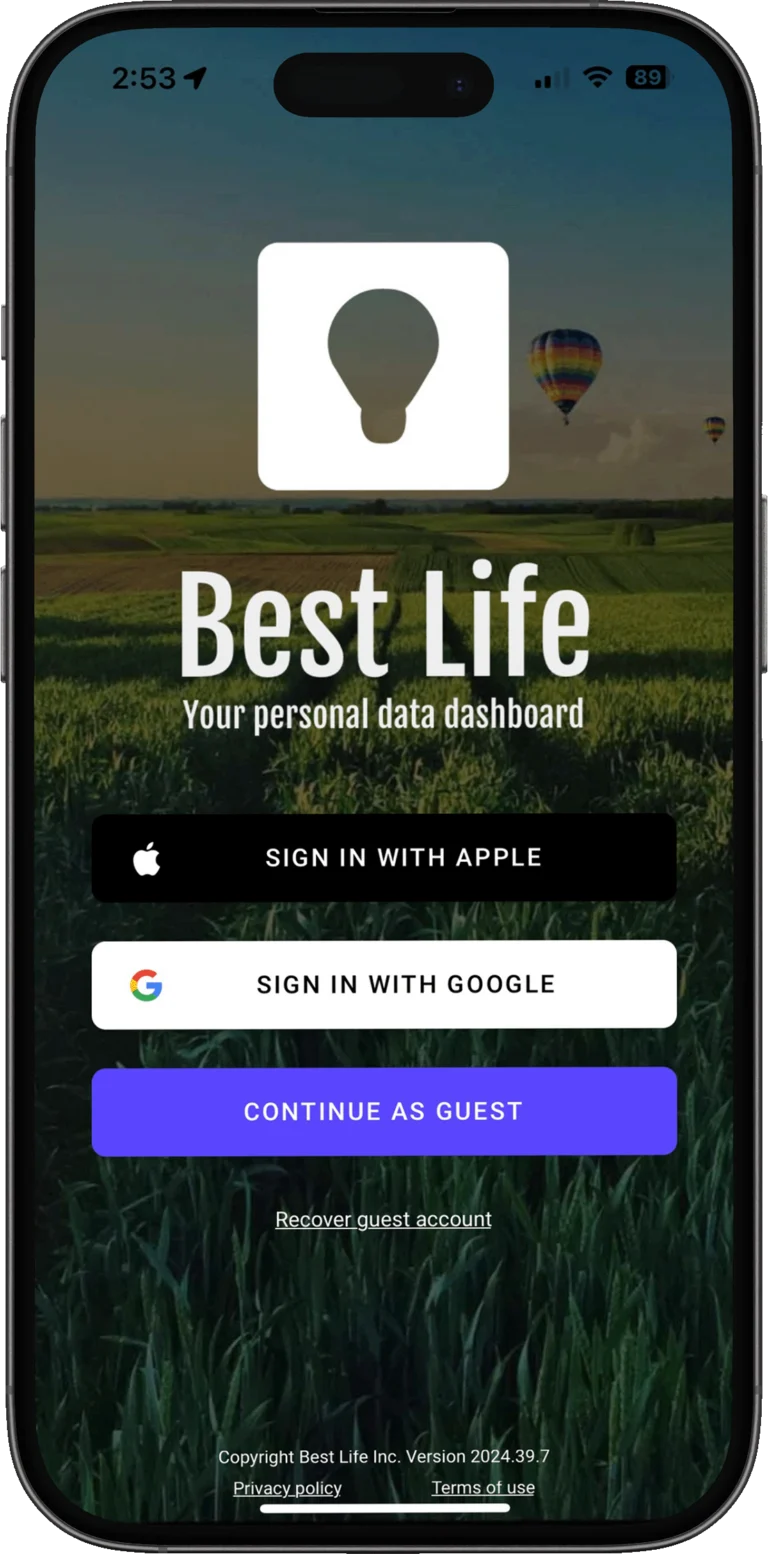
Start using Best Life as your health and wellness app
Use Google or Apple to Create an Account
Finally, you can have a health and wellness tool all-in-one mobile app, without pharmaceutical bias, with privacy, and with the flexibility to see what you want to see.
Best Life is a mobile app and software dashboard that allows you to gain insights into health and habits by comparing past data entries with fitness tracker, mood tracker, symptom tracker, and weather data.
Use the links on this page to download or open the Best Life app on the Google Play or Apple App Store. Then sign in using whatever account type you’re used to using.
We use a single sign-on (SSO) method of account creation to help cut down on risk and all those excess account logins you’ve likely got out there. We do this so you never have to remember yet another password.
Data helps improve health and wellness
Select a default timezone, and enable health data syncs and location info. This last part is critical for someone looking to manage anything related to their local weather and pollen.
With all sorts of ways to add data to Best Life, you can add quick activity entries using Events and then elaborate on your day later in a Note.
Tips for better data
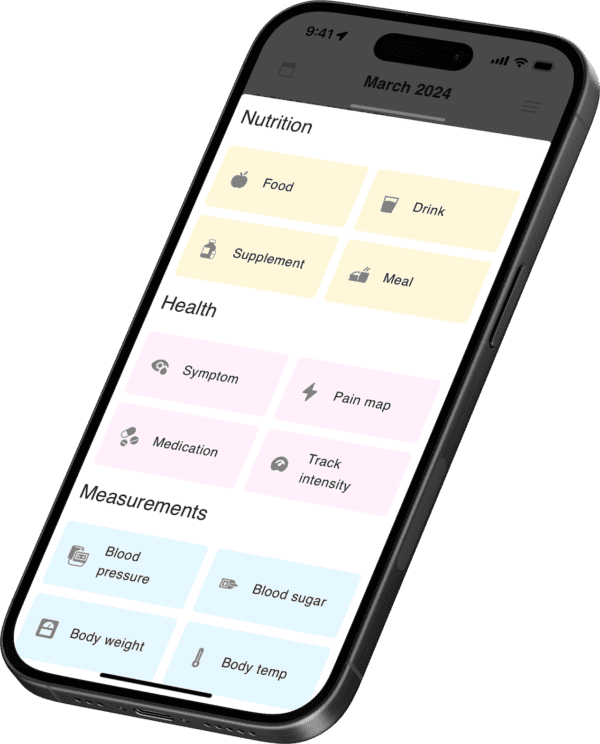
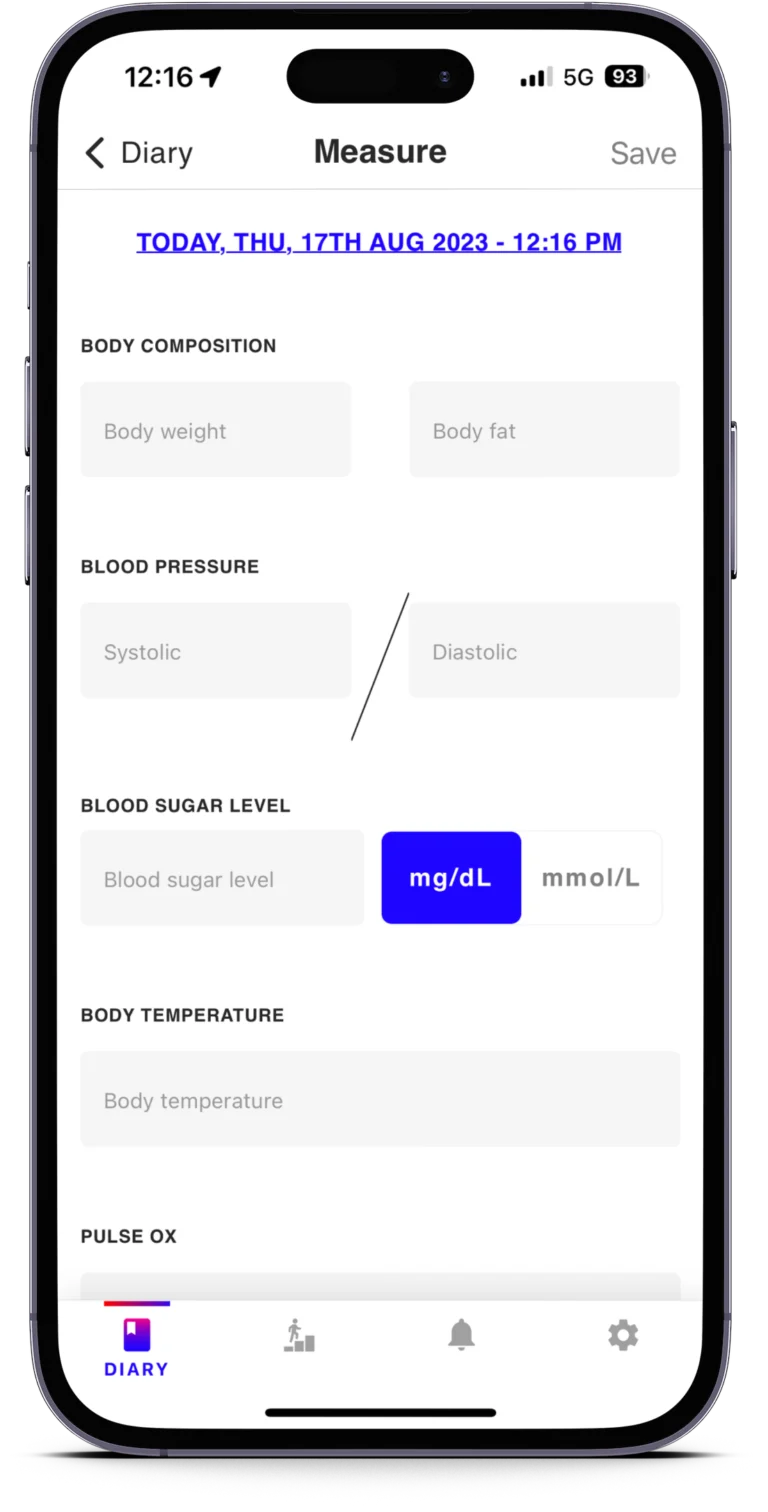
- Measurements keep track of things like body weight, temperature, blood sugar, and others
- Use Events to log almost everything (activity, symptoms, medication, etc)
- Be consistent in your naming structure (if you say ‘meditation’, stick with it!)
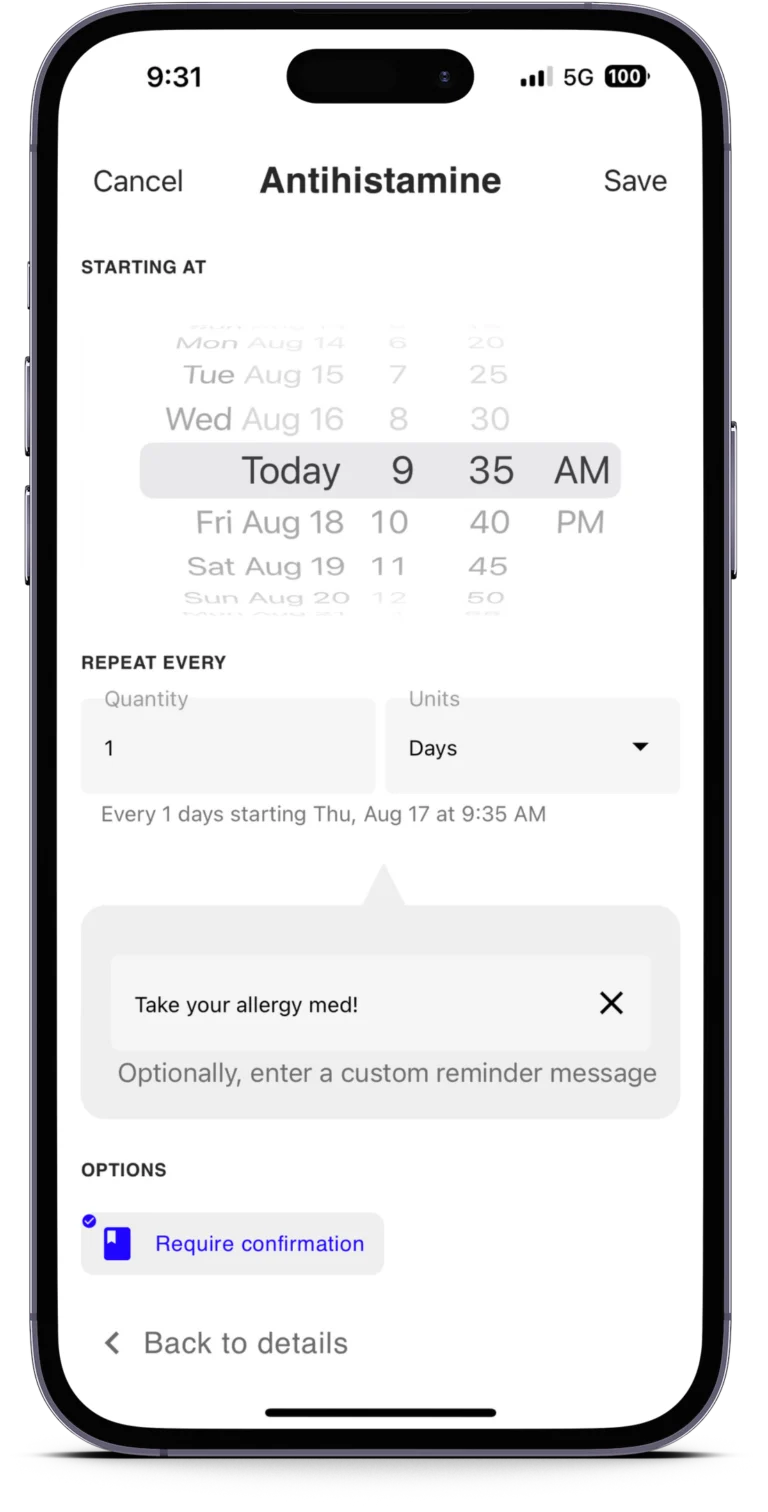
- Any Event can have more detail, just tap the pencil icon once it’s on your entry list

Learn your triggers and see what really works
Combine your Best Life data with your health trackers for more accurate insight. See health data combined with your mood and stress ratings, habits, and just about anything else.
Best Life is a powerful tool for helping you take control of your life. Track data like what time of day and how long you spent writing, then compare it to your environment, symptoms, and other data.
- Once you select a graph, on the top-right you can filter Events to show on top
This helps you, your loved ones, and your doctors see a complete view if you choose to share it with them.
Be the one who benefits from your data
Discover new data trends, plot symptoms over weather graphs, and see your data like you never have before. Take your life by the data and demand the value return everyone deserves.
Our roadmap for health and wellness features
- Duration graphs for Events that last any amount of time
- Custom Event groups like “morning routine”
- Data imports from popular daily diaries like Daylio

FAQ about health and wellness using Best Life by LLIF
Why am I asked to enable Location services?
Using Best Life just for journaling? You can probably pass on this!
The temperature, barometric pressure, humidity, and other factors definitely have an impact on your day to day.
Enabling location services lets your diary capture those daily differences.
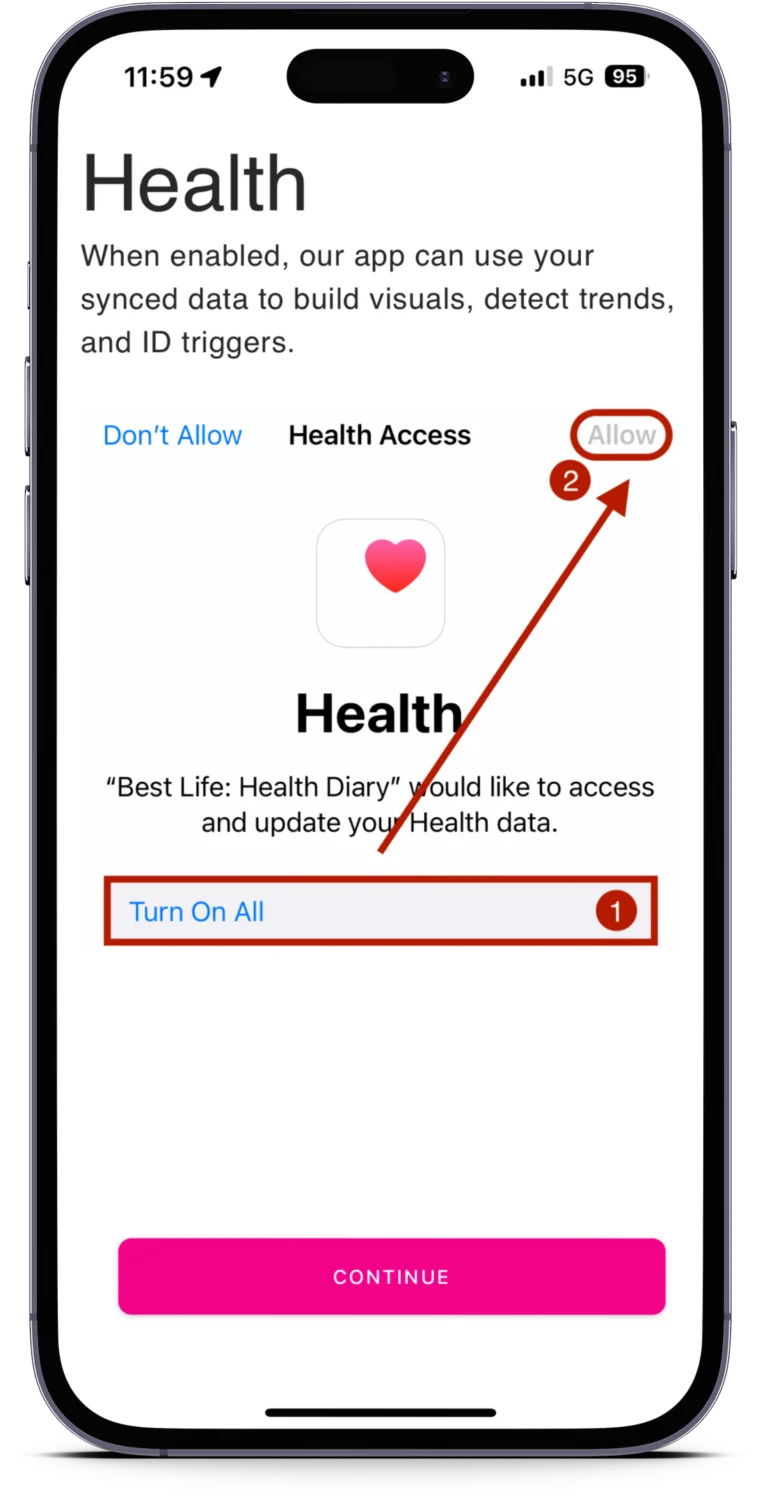
Do I need to enable Health services, too?
Using Best Life just for journaling? You can probably pass on this!
Optional only! However, by syncing the Health data that your Apple Health kit or Google Fit already captured, you can see even more trends in your own data.
How do I see my Events on a graph?
Once in your Diary, go ahead and tap the bottom menu icon for the little person on their data! Scroll to the Event count graph and tap into it.
In the top-right of each graph you will find the search and filter icon that opens a drawer with the ability to add specific Events on top of the data you’re reviewing.
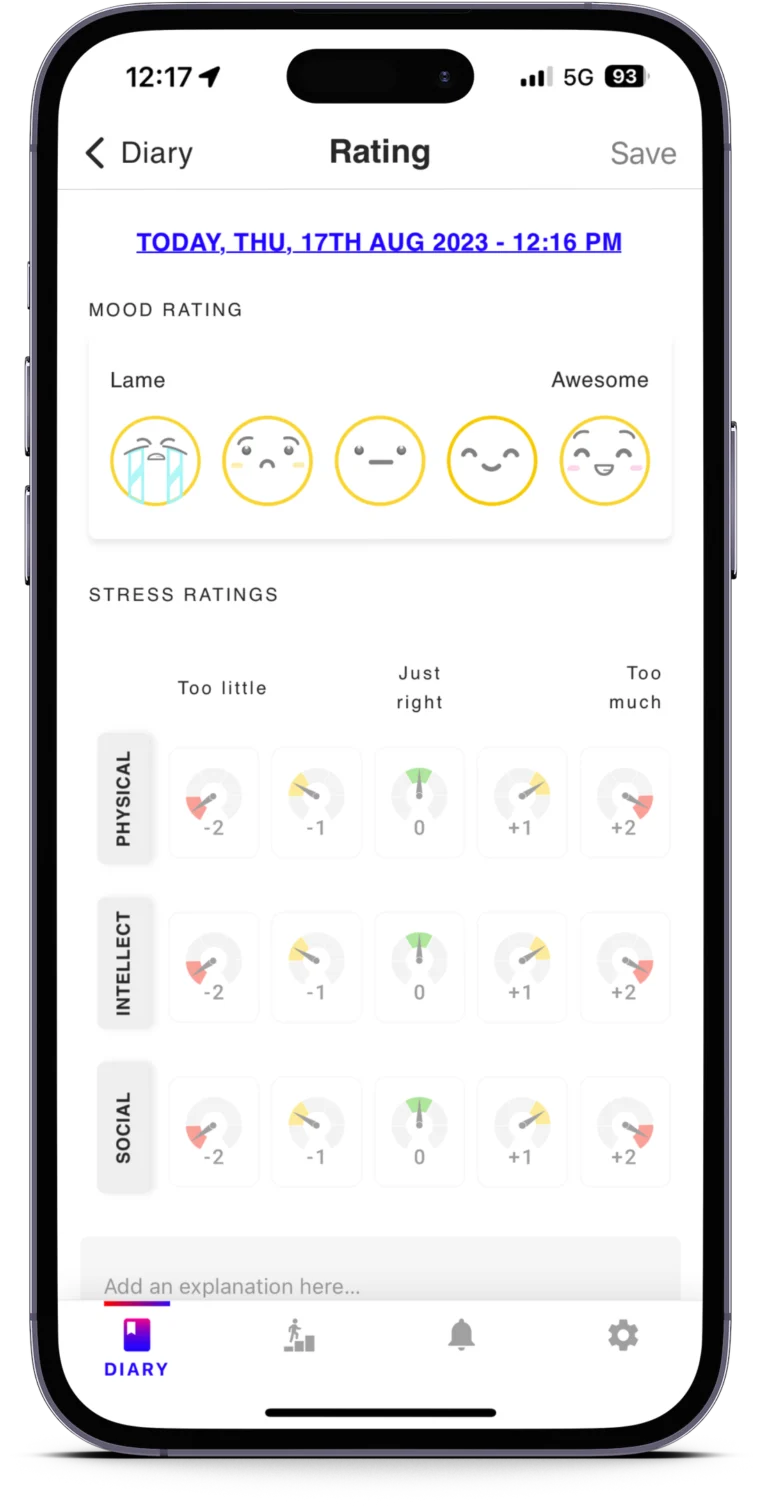
How do I use the mood tracker?
Hit that awesome plus sign button on your Diary page once you’re in the app. From there, hit Rating and you’ll be able to add a mood rating.
You can also add stress ratings using the Goldilocks scale from this view.
What does the mood and stress graph show me?
In your list of graphs you will find the Mood and Stress graphs. The Mood graph will show you your daily, weekly, monthly, or annual average mood over time.
The Stress graph breaks into three variables (physical, social, intellectual) and plots those on an area chart using the same scales.
How do I get more data providers connected?
Let us know what data you want to see next by contacting our team online!
Want to see it even sooner though? Donate your time, effort, or contribute funds for our team to hire more software engineers.
Every dollar is a great addition to bringing data rights back to people.
Read more about health and wellness
Show your support by following us on social media

Hello World — Come Get to Know Us
You don’t need another tracker—you need a partner.
Best Life turns simple daily logs into visible patterns that help you make better
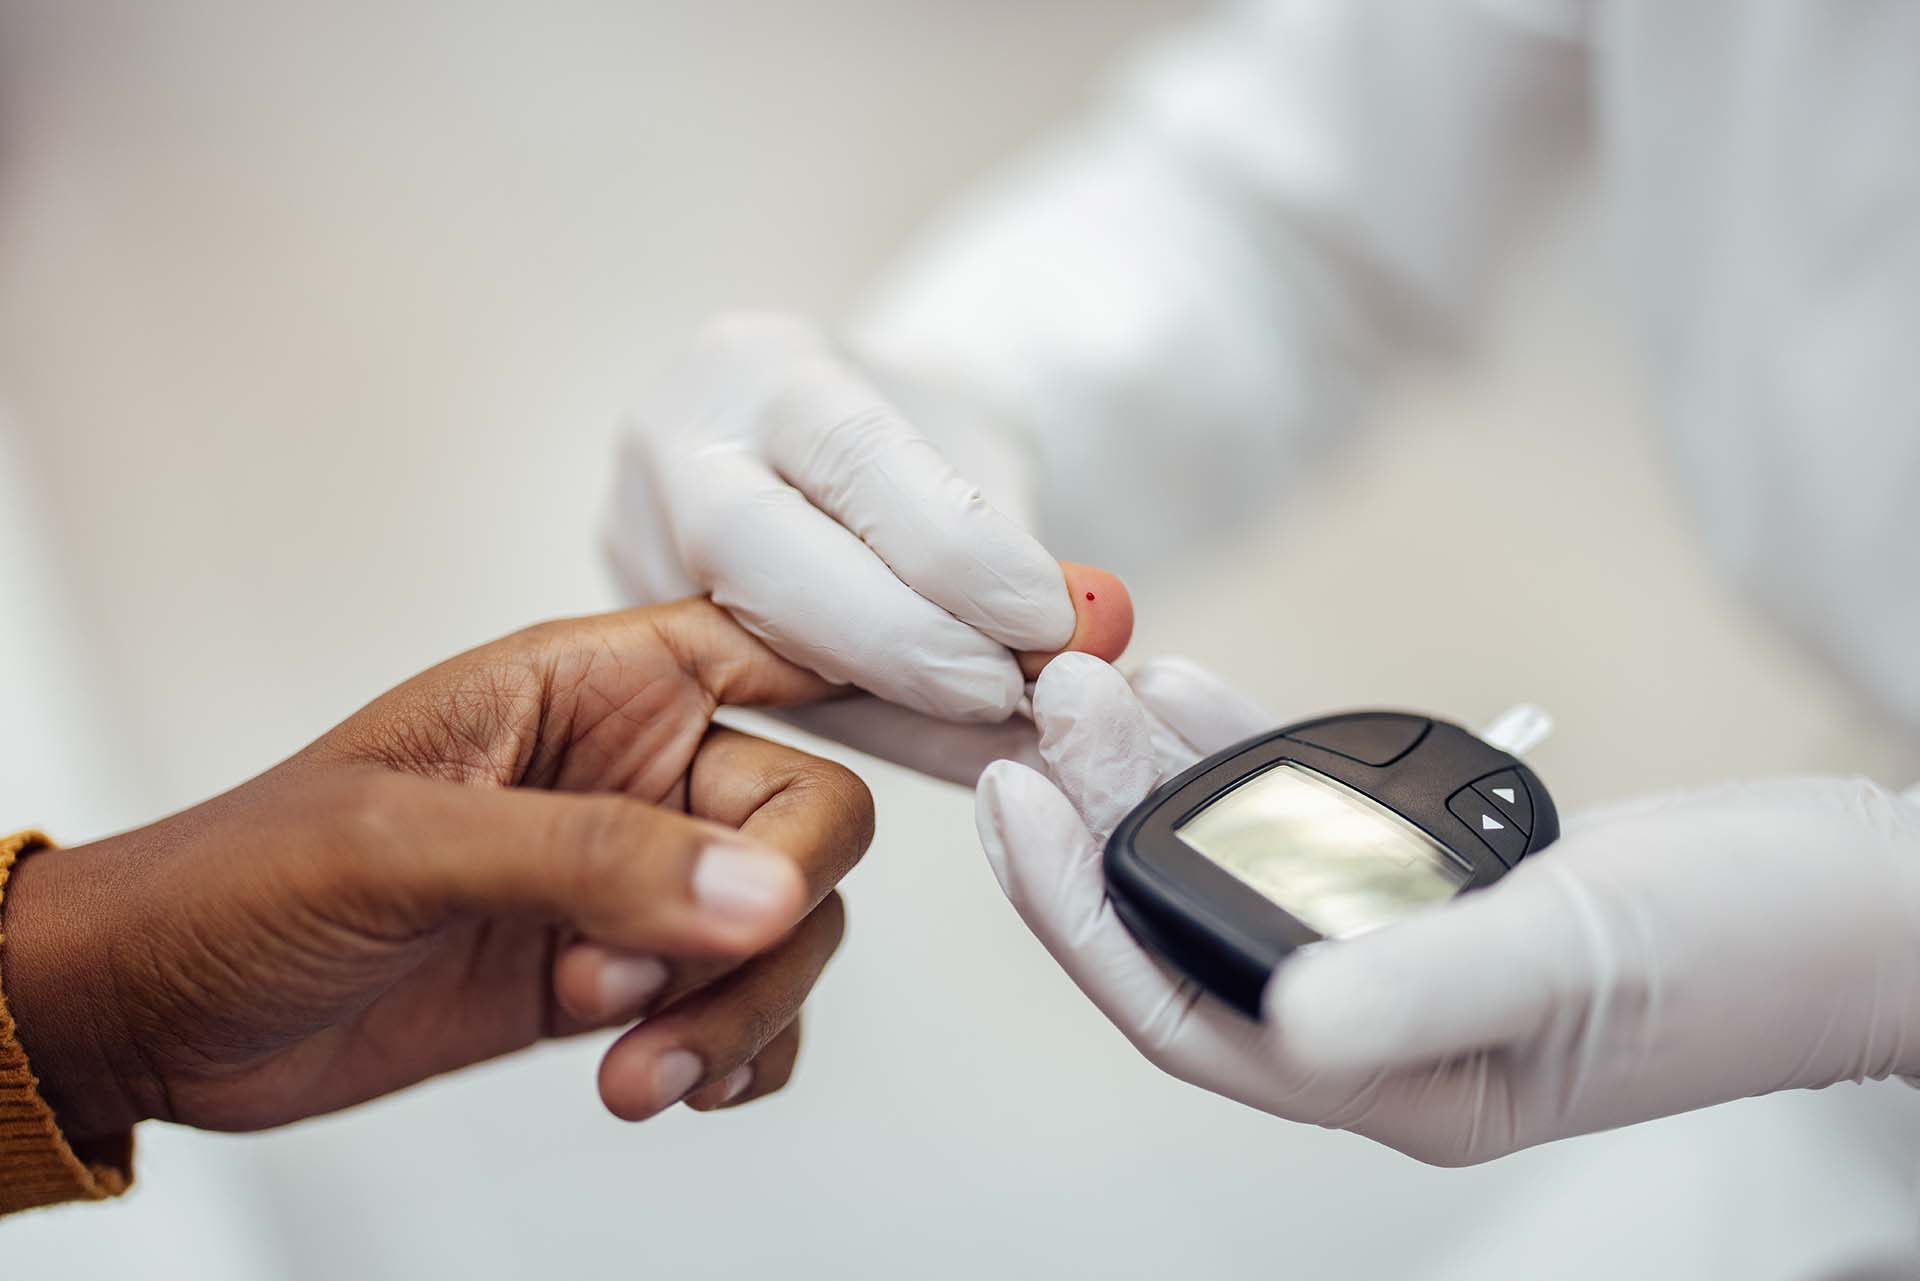
No, Smart Watches and Rings Can’t Really Measure Blood Sugar
Smart watches and fitness trackers like Apple Watch, Oura Ring, and Fitbit cannot directly measure blood sugar levels, despite many users believing
You can help bring back data independence
It’s as easy as buying a coffee for a friend
Predictive analytics leading to decision support will empower you and your community to avoid uninformed decisions, mitigate events with negative consequences, and promote situations with positive outcomes. Even small improvements in decision making have enormous benefits to physical health, mental health, financial savings, and so much more.