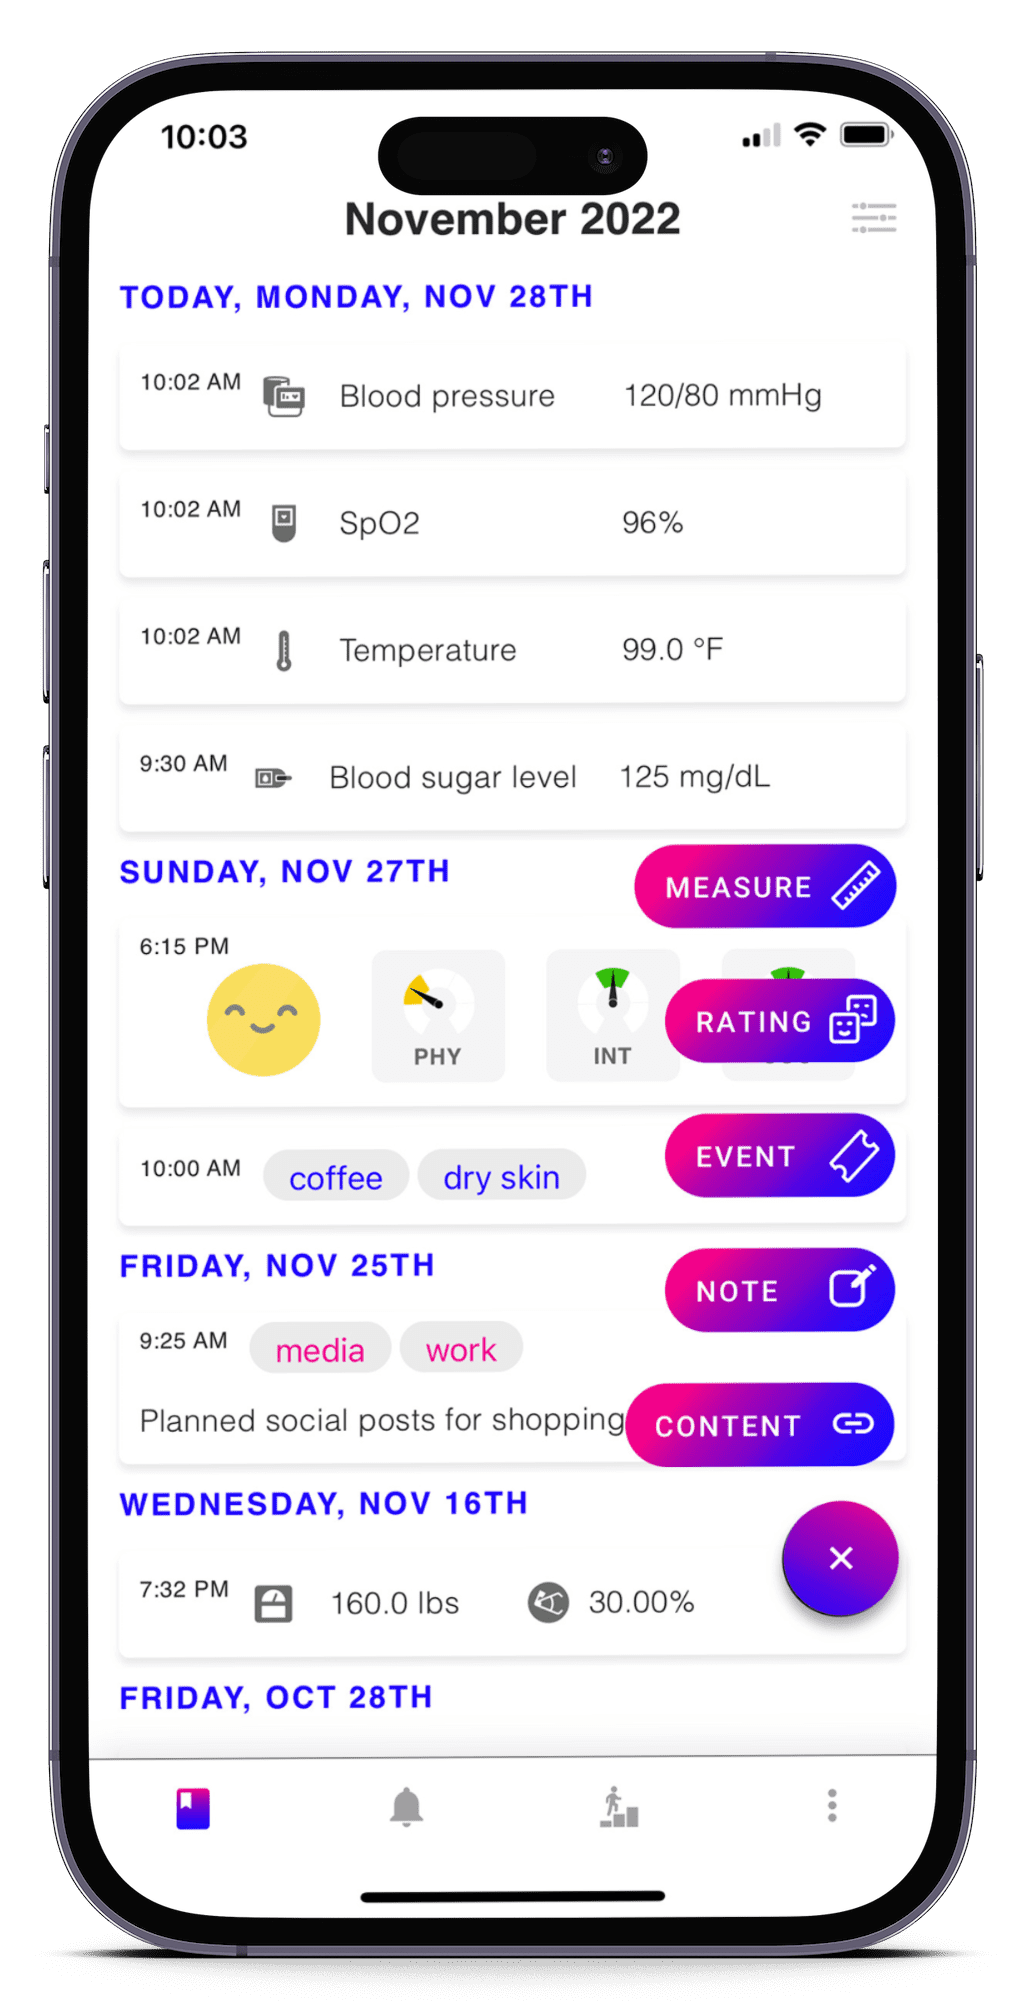
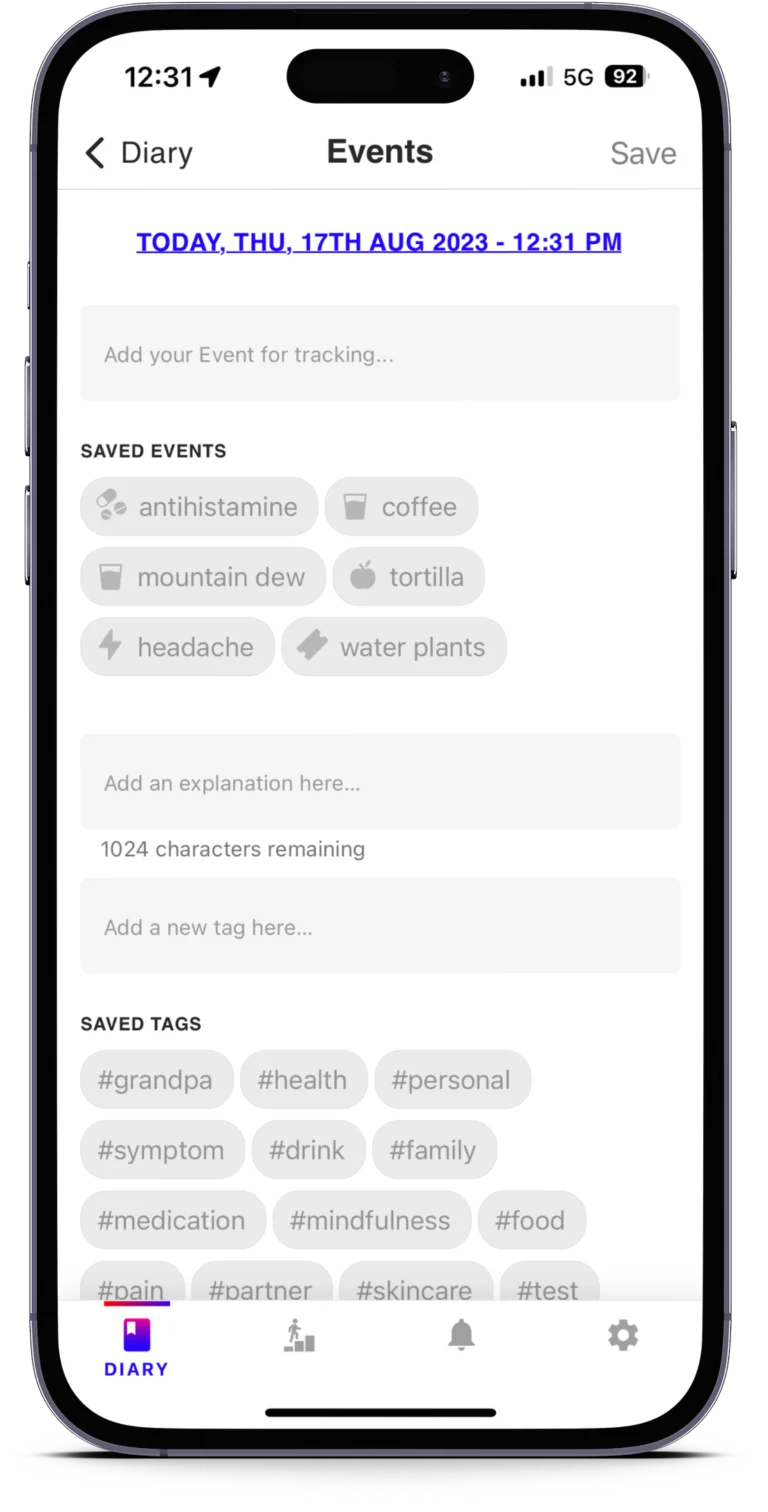
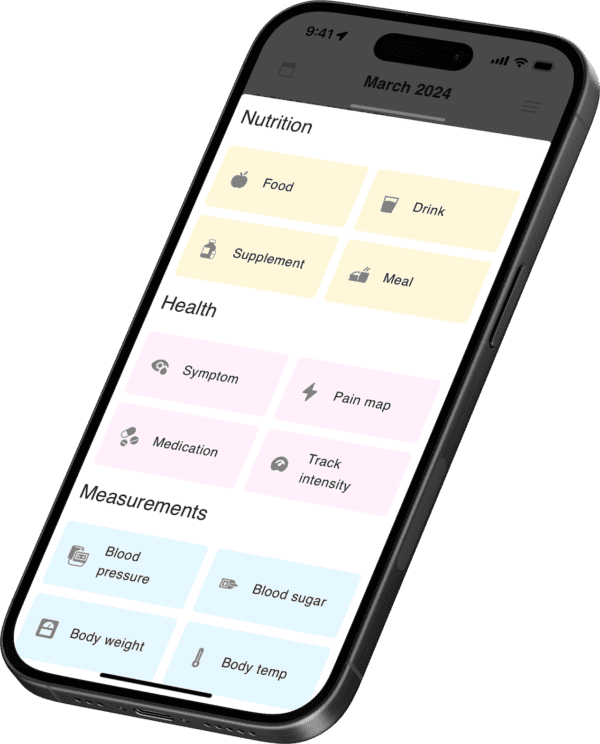
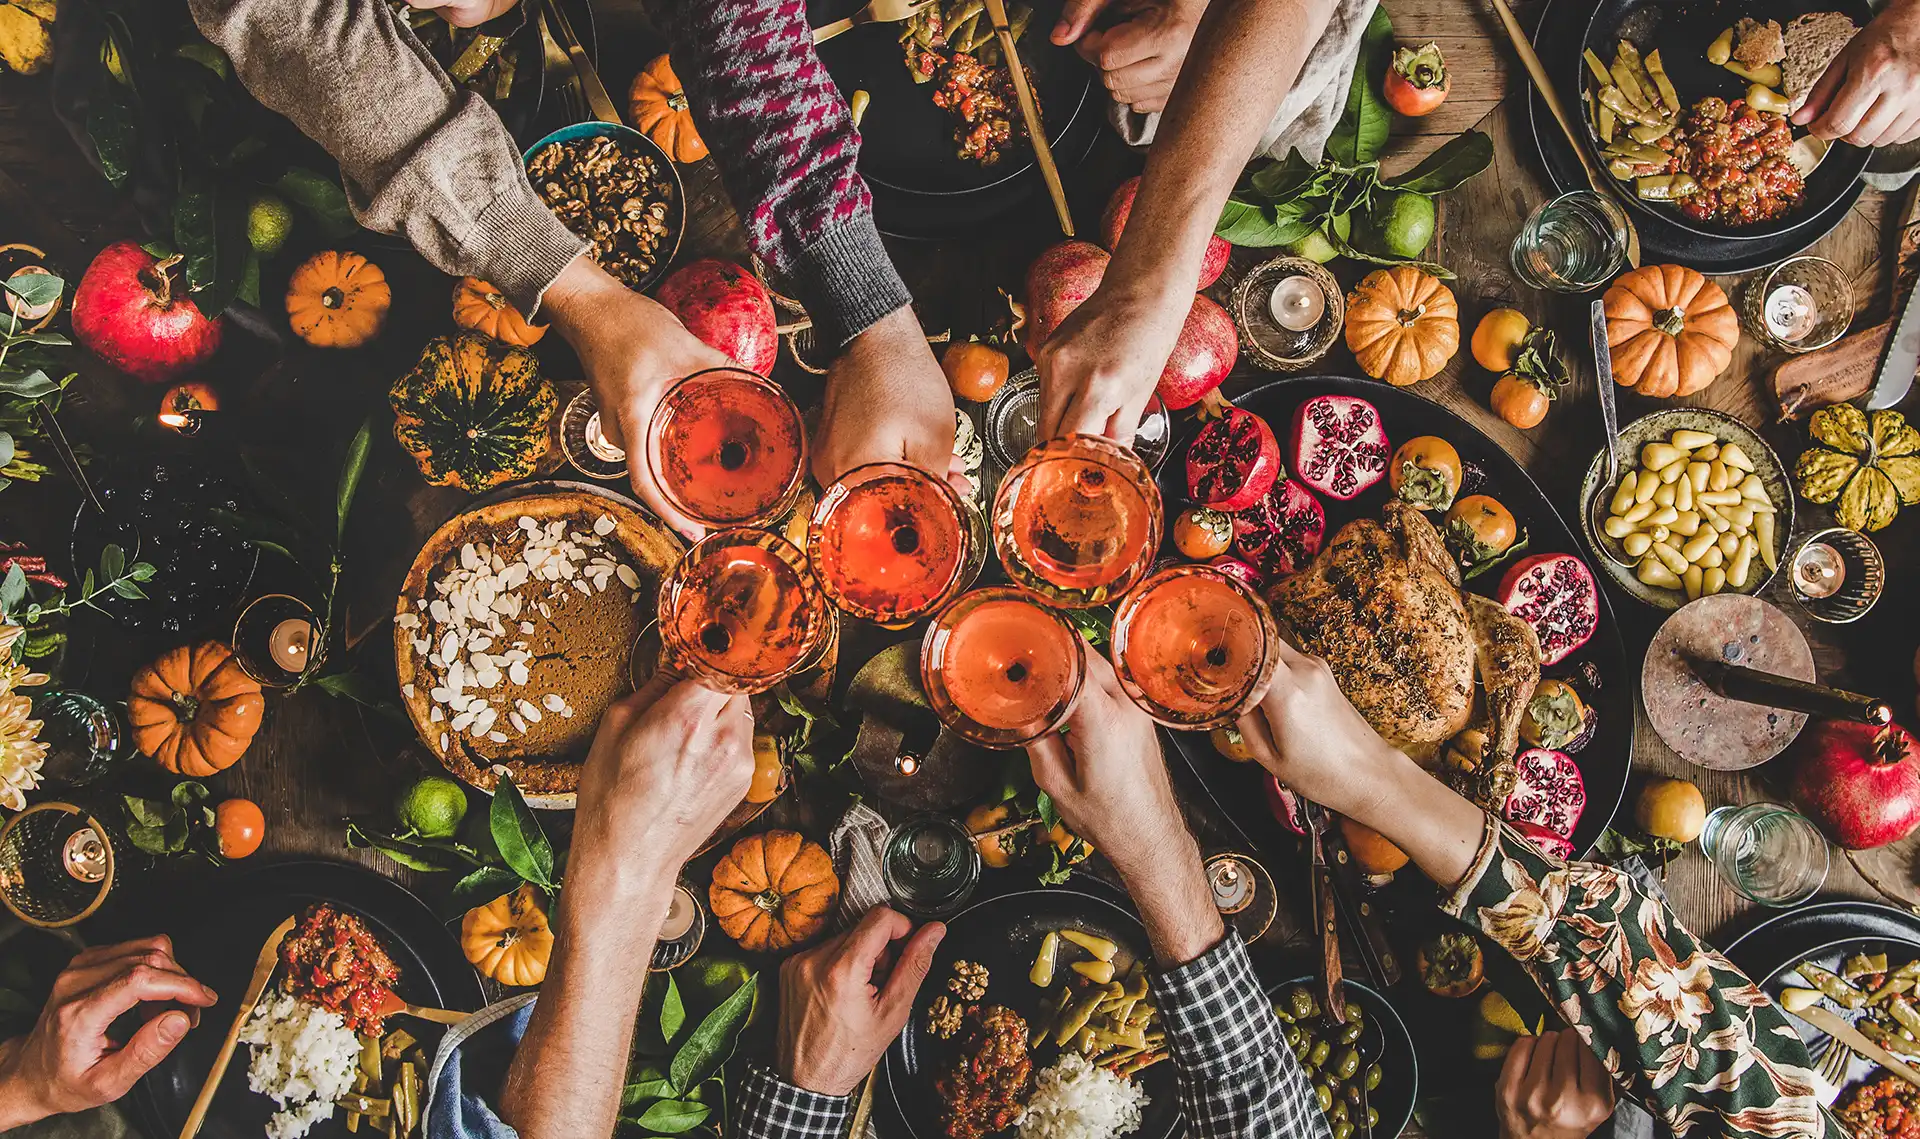
Habit tracker mobile app

Recapture the control you want. Manage habits, good and bad

Use this habit tracker app to track and manage your daily habits. Best Life Health Diary is the only mobile app that includes your digital data, location-based weather data, and sustainable, long-term security, plus it’s made and managed by a nonprofit. (This matters for your data privacy!)

Benefit in multiple ways by tracking your habits

Best Life can be used to track habits, good and bad. Want to see how you feel after a certain event, medication, or social visit? Wonder if it’s the person or the place that makes you have jitters?

It won’t be a mystery anymore.

best life health diary mobile app by live learn innovate foundation llif

It can take anywhere between 18 to 254 days to form a new habit.

Form and break habits how you see fit with an event-based mobile app to help habit tracking.

Supporting data from these providers

Finally, a habit tracker app with flexibility

An easy to use habit tracker with flexibility to be what you want it to be! Without interference, you can give yourself the space to just be present. This is not your typical note taking app. We don’t make you feel like you just joined a writing course when you’re trying to jot down that thought.

More than a memo pad

You can plan your day according to local factors, your personal habits, measure your goals with real data, and understand your emotions with a science-backed mood tracker. Our highly customizable Event tracking feature lets you track everything from health to home maintenance and visualize the results with easy-to-understand graphs.

Reveal new insights when tracking habits with Best Life

A healthy and creative habit, bullet journaling enhances mental health.

Cope with emotional turmoil, like depression. Reduce the impact of negative responses to anxiety. Prioritize things in your life easier. Give yourself a chance to be mindful and self-advocating.

Best Life is the first community nonprofit and intelligent data platform for people with high levels of mindfulness.

The only habit tracker mobile app with all your environmental factors.

Get pollen data based on where you are—even when you travel. You’ll be able to easily track and compare across your health data from day-to-day. Tree, weed, and grass pollen count data plus air quality, ozone, air particulate matter and more.

This is the best habit tracker app that gives you the big picture of your digital life, daily habits, mental, and physical health.

Habit tracker benefits touch all parts of life

Improve self-awareness

Achieve higher levels of self-awareness! Tracking habits helps you recognize patterns in your behavior and lifestyle - a powerful insight for positive change.

Reach for realistic goals

Set realistic goals based on your actual habits and behavior. Use data to identify areas that need focus and adjust your own effort on the fly.

Maintain motivation

Keep going with high levels of motivation! Seeing small successes help you see you are making progress. Feel the reward when looking back to see how far you've come.

Start using Best Life as your habit tracker app

best life health diary mobile app by live learn innovate foundation llif

FAQ about habit tracking using Best Life by LLIF

Using Best Life just for journaling? You can probably pass on this!

The temperature, barometric pressure, humidity, and other factors definitely have an impact on your day to day.

Enabling location services lets your diary capture those daily differences.

Using Best Life just for journaling? You can probably pass on this!

Optional only! However, by syncing the Health data that your Apple Health kit or Google Fit already captured, you can see even more trends in your own data.

Once in your Diary, go ahead and tap the bottom menu icon for the little person on their data! Scroll to the Event count graph and tap into it.

In the top-right of each graph you will find the search and filter icon that opens a drawer with the ability to add specific Events on top of the data you’re reviewing.

Hit that awesome plus sign button on your Diary page once you’re in the app. From there, hit Rating and you’ll be able to add a mood rating.

You can also add stress ratings using the Goldilocks scale from this view.

In your list of graphs you will find the Mood and Stress graphs. The Mood graph will show you your daily, weekly, monthly, or annual average mood over time.

The Stress graph breaks into three variables (physical, social, intellectual) and plots those on an area chart using the same scales.

Let us know what data you want to see next by contacting our team online!

Want to see it even sooner though? Donate your time, effort, or contribute funds for our team to hire more software engineers.

Every dollar is a great addition to bringing data rights back to people.

Read more about habit tracking

Follow us on social media

You can help bring back data independence

It’s as easy as buying a coffee for a friend

Predictive analytics leading to decision support will empower you and your community to avoid uninformed decisions, mitigate events with negative consequences, and promote situations with positive outcomes. Even small improvements in decision making have enormous benefits to physical health, mental health, financial savings, and so much more.

If the form above does not appear, please visit this page.