Feeling SAD? Defeat Seasonal Affective Disorder by Mood Tracking
Explore how to treat and manage Seasonal Affective Disorder (SAD) with Best Life’s mood tracker, integrating weather data for holistic mental health
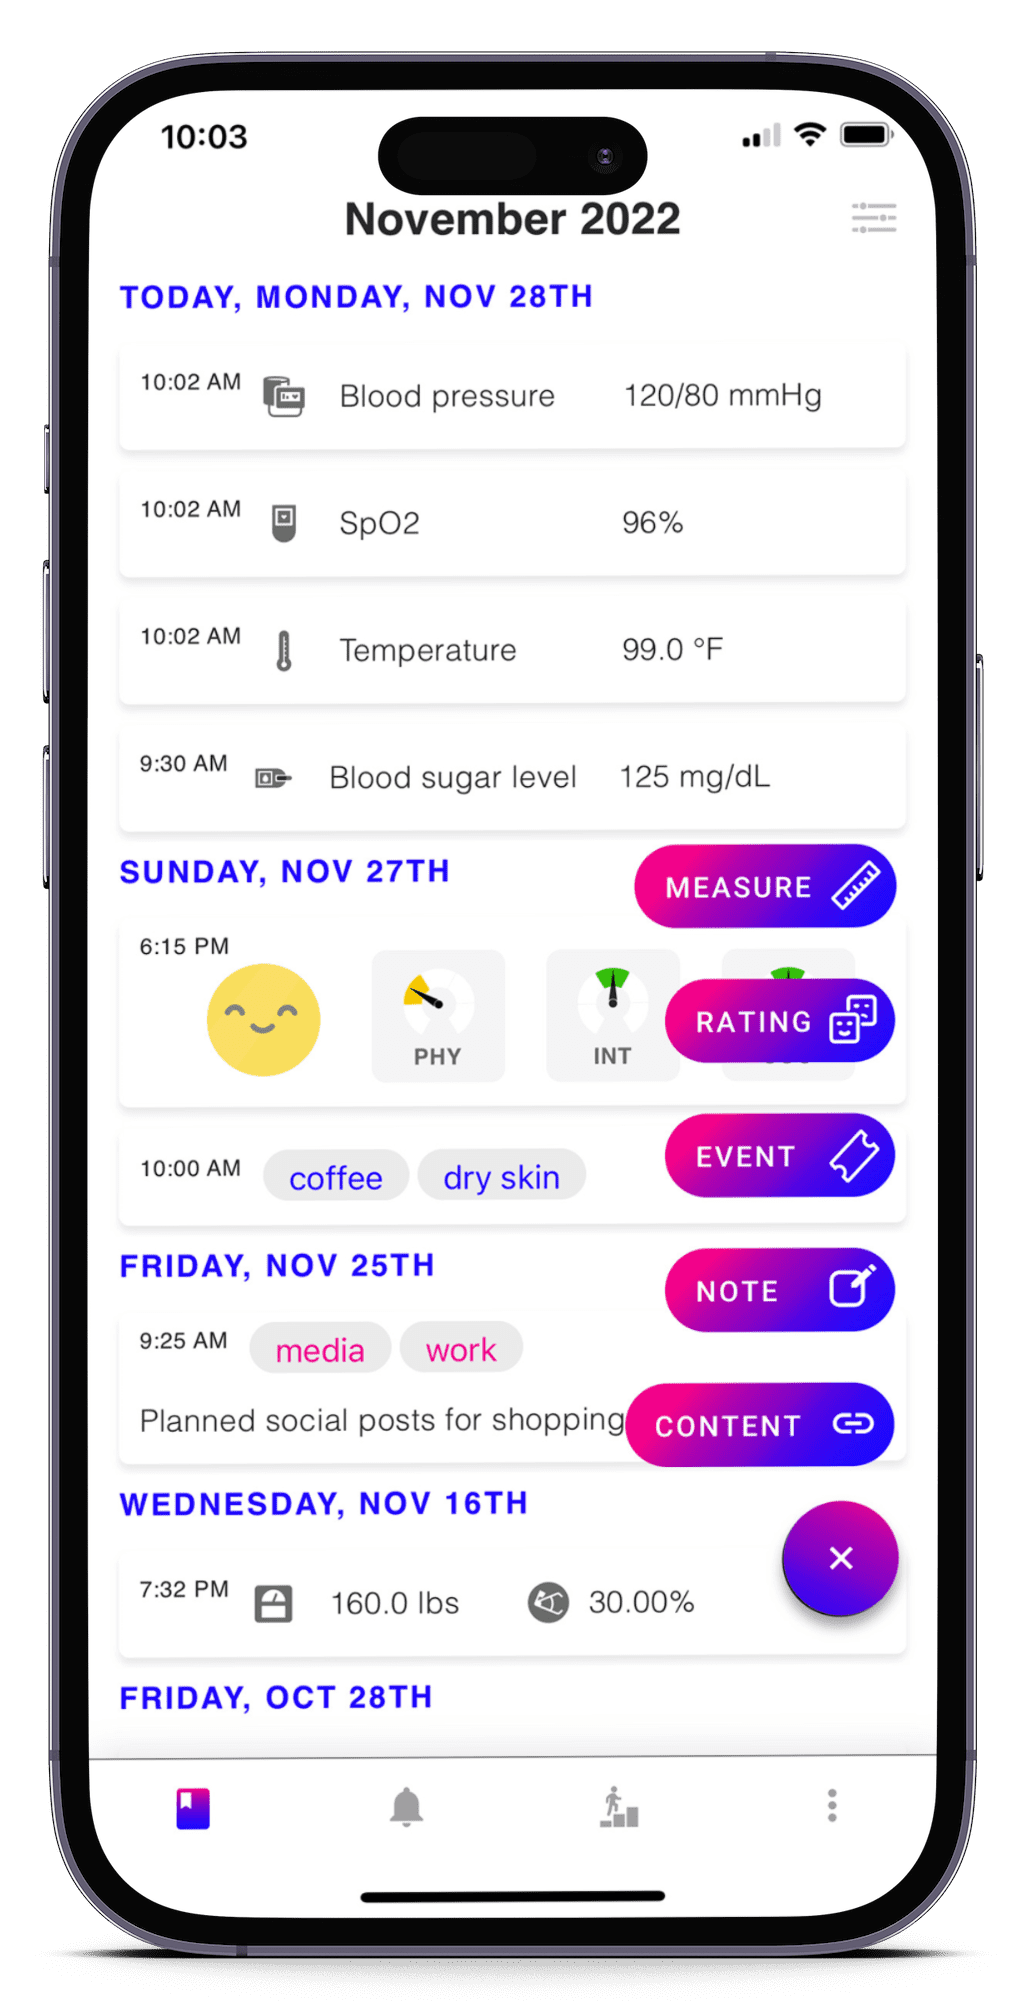
Discover the unique benefits of our mood tracker app, the only one that combines a bullet journal with environmental data, web, and social activity, and a symptom log. Gain insights into your health like never before. See what impacts your depression, anxiety, and more.
Just as easily, see what keeps you strong, positive, and happy.
Stay on top of your tasks, capture your thoughts easily, and never forget important dates like birthdays. Learn what leads to your mood swings, increase your quality of life, achieve your mental health goals, detect chronic conditions, and more using this mood tracker.
Powered up with weather data, your own daily symptom log, activity tracking, and a bullet journal, Best Life simplifies hundreds of other tools to become your super app.
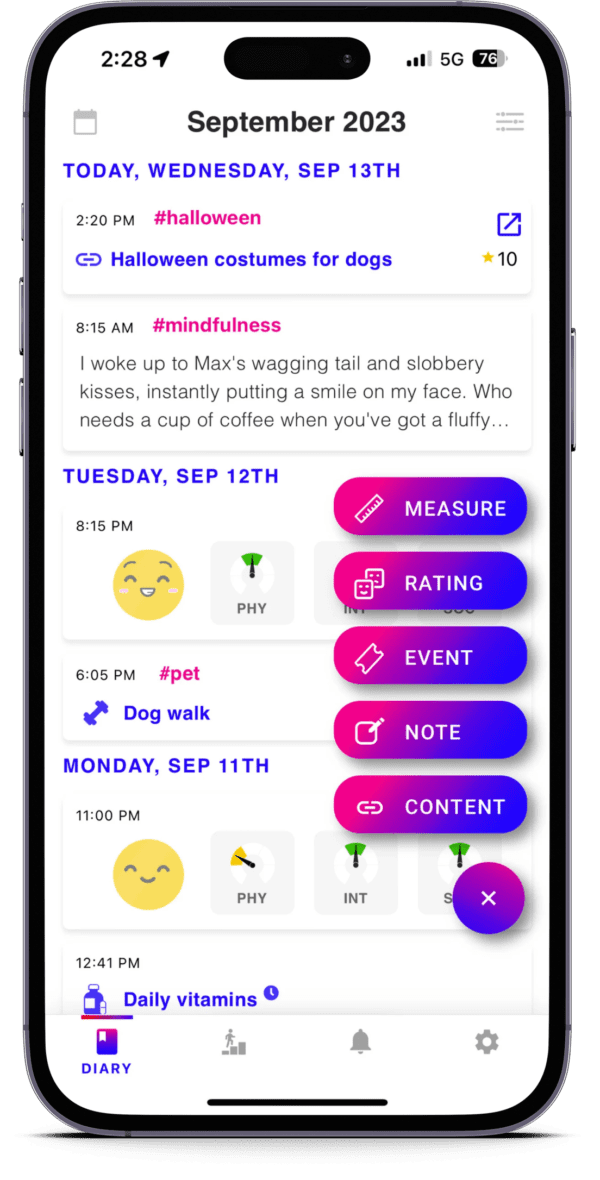
Tracking your mood with a mood tracker increases mindfulness, reducing stress and anxiety.
Supporting data from these providers
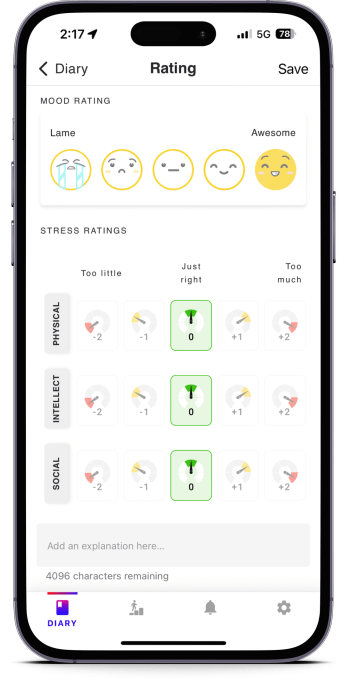
With a standard mood rating and a unique goldilocks score system for your stress logs, you have the chance to gain untold insight into your mental and physical health.
Want more? See all your data from providers like Apple Health, Google Fit, Fitbit, and others. Find out what impacts your life whether it’s symptoms, triggers, weather, or activity.
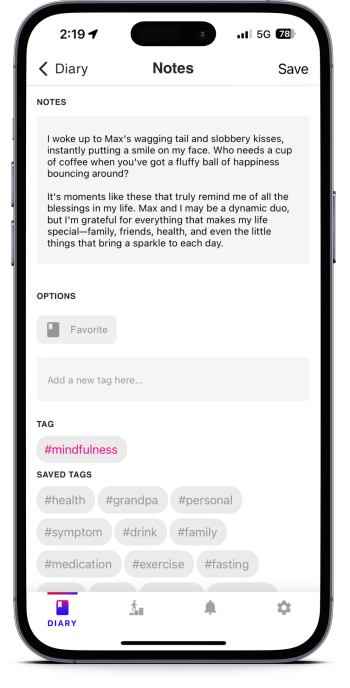
Best Life includes a notes feature for you to add any and all thoughts from a mindfulness routine to a grocery list.
Tag your entries to filter and search for them later.
Draw your own conclusions from your data without the risk of provider bias and influence. Use your existing graphs and plot Events on top to see how they impact your life.
Best Life is the first and only mood tracker and bullet journal that includes environment data too. Now you can see how the weather conditions affect your mood and stress.
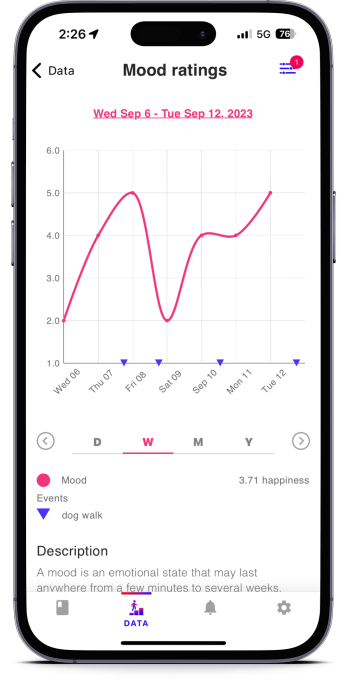
An easy to use mood tracker and journal with flexibility to be what you want it to be! Without interference, you can give yourself the space to just be present. This is not your typical note taking app. We don’t make you feel like you just joined a writing course when you’re trying to bullet journal out that thought.
More than a memo pad, you can plan your day according to local factors, your personal habits, measure your goals with real data, and understand your emotions with a science-backed mood tracker. Our highly customizable Event tracking feature lets you track everything from health to home maintenance and visualize the results with easy-to-understand graphs.
It is easy to get lost in the daily grind. Take as much or as little time as you like to log your day. Build your own virtual space to focus on you, with measurable benefits.
Our Best Life mood tracker presents your mood and stress ratings, and all your other entries back to you in easy to understand graphs.
Sometimes you feel bad and don't know why. With consistency in your mood tracking, you can draw unbiased conclusions from data, or just wait for a trend alert.
Cope with emotional turmoil, like depression. Reduce the impact of negative responses to anxiety. Prioritize things in your life easier. Give yourself a chance to be mindful and self-advocating.
Best Life is the first community nonprofit and intelligent data platform for people with high levels of mindfulness.
Get pollen data based on where you are—even when you travel. You’ll be able to track and compare your health data from day to day easily.
Tree, weed, and grass pollen, plus air quality, ozone, air particulate matter, and more, you’ll learn things you never thought of.
Still need some convincing? Here are four great reasons to start using Best Life as your mood tracker app today!
Finally, you can have a mood tracker all-in-one mobile app, without pharmaceutical bias, with privacy, and with the flexibility to see what you want to see.
Best Life is a mobile app and software dashboard that allows you to gain insights into health and habits by comparing past data entries with fitness tracker, mood tracker, symptom tracker, and weather data.
Use the links on this page to download or open the Best Life app on the Google Play or Apple App Store. Then sign in using whatever account type you’re used to using.
We use a single sign-on (SSO) method of account creation to help cut down on risk and all those excess account logins you’ve likely got out there. We do this so you never have to remember yet another password.
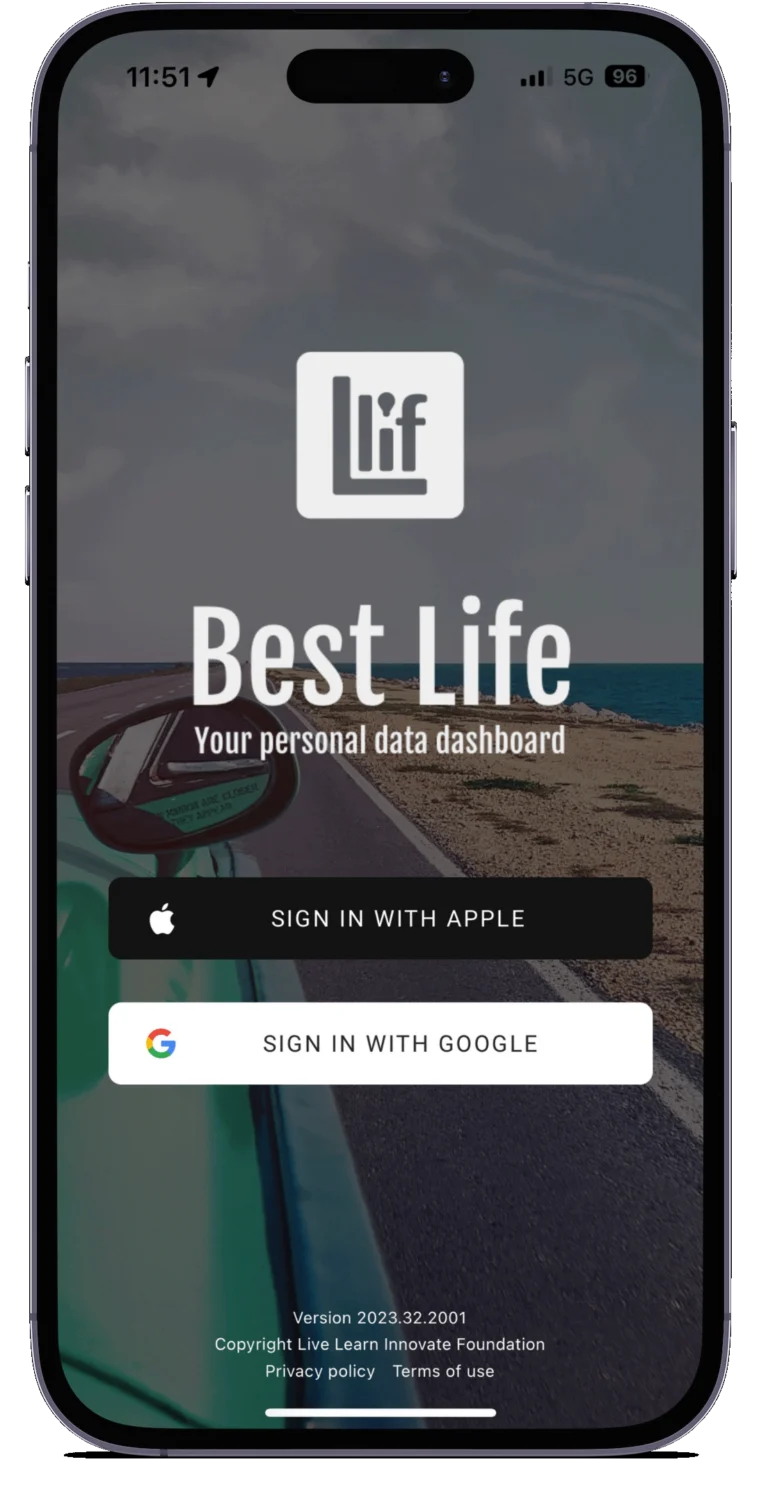
Select a default timezone, and enable health data syncs and location info. This last part is critical for someone looking to manage anything related to their local weather and pollen.
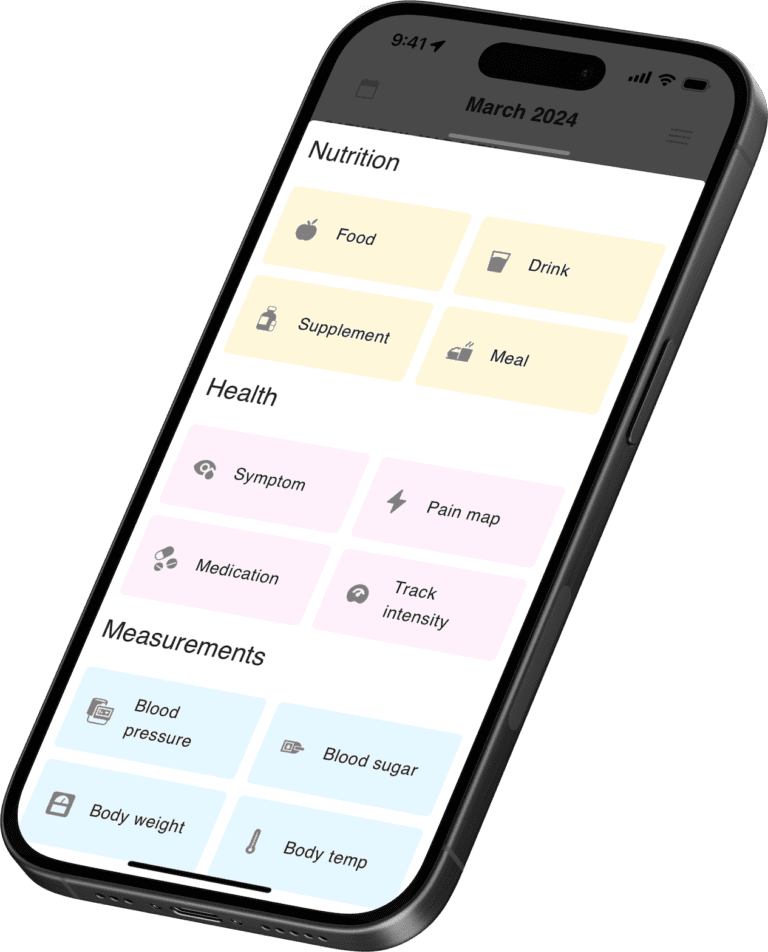
With all sorts of ways to add data to Best Life, you can add quick activity entries using Events and then elaborate on your day later in a Note.
Combine your Best Life data with your health trackers for more accurate insight. See health data combined with your mood and stress ratings, habits, and just about anything else.
Best Life is a powerful tool for helping you take control of your life. Track data like what time of day and how long you spent writing, then compare it to your environment, symptoms, and other data.
This helps you, your loved ones, and your doctors see a complete view if you choose to share it with them.
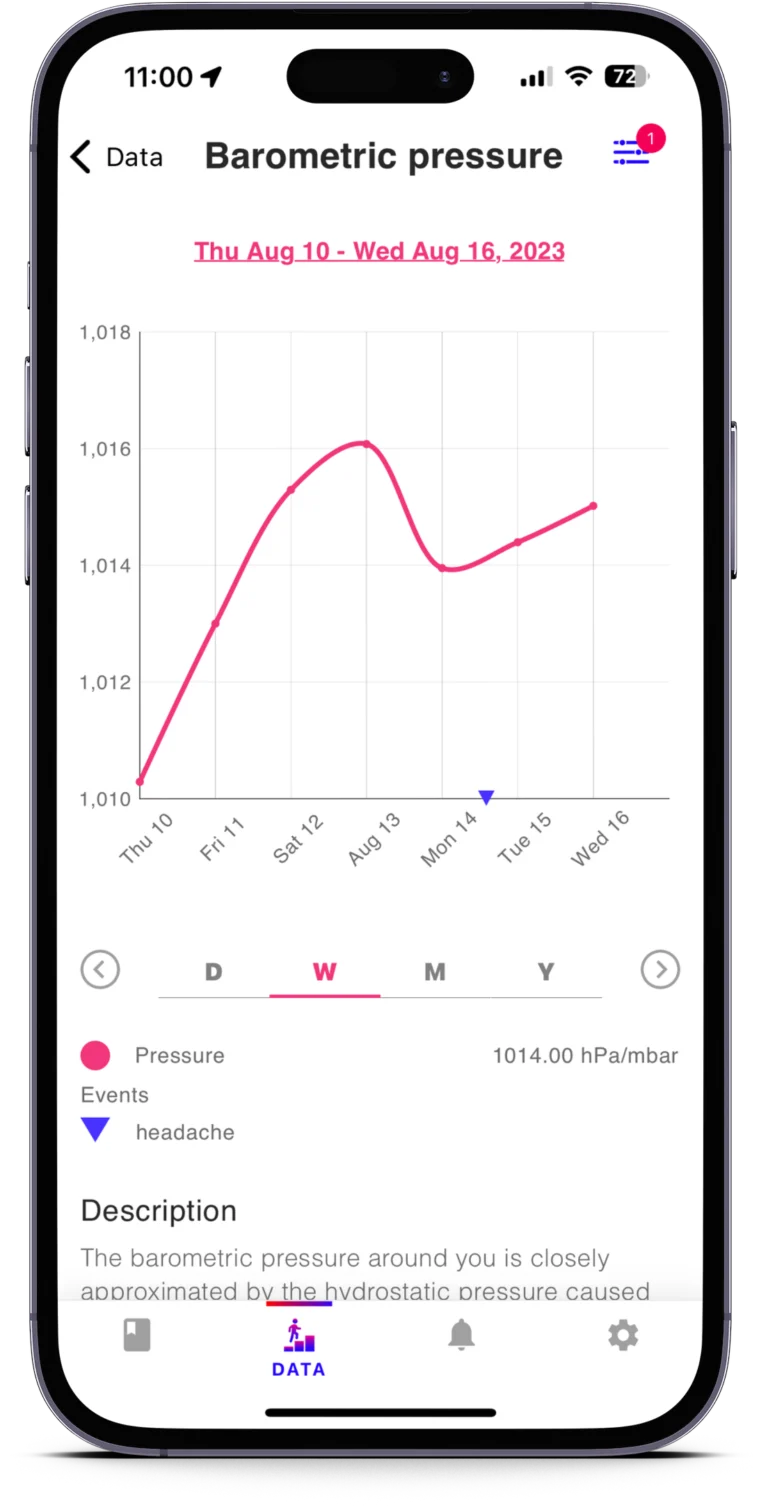
Discover new data trends, plot symptoms over weather graphs, and see your data like you never have before. Take your life by the data and demand the value return everyone deserves.
Our roadmap for mood tracker features
Using Best Life just for mood tracking? You can probably pass on this! However, if you live where it’s always sunny or rainy it could be helpful information.
The temperature, barometric pressure, humidity, and other factors definitely have an impact on your day to day.
Enabling location services lets your diary capture those daily differences.
Using Best Life just for journaling? You can probably pass on this!
Optional only! However, by syncing the Health data that your Apple Health kit or Google Fit already captured, you can see even more trends in your own data.
Once in your Diary, go ahead and tap the bottom menu icon for the little person on their data! Scroll to the Event count graph and tap into it.
In the top-right of each graph you will find the search and filter icon that opens a drawer with the ability to add specific Events on top of the data you’re reviewing.
Hit that awesome plus sign button on your Diary page once you’re in the app. From there, hit Rating and you’ll be able to add a mood rating.
You can also add stress ratings using the Goldilocks scale from this view.
In your list of graphs you will find the Mood and Stress graphs. The Mood graph will show you your daily, weekly, monthly, or annual average mood over time.
The Stress graph breaks into three variables (physical, social, intellectual) and plots those on an area chart using the same scales.
Let us know what data you want to see next by contacting our team online!
Want to see it even sooner though? Donate your time, effort, or contribute funds for our team to hire more software engineers.
Every dollar is a great addition to bringing data rights back to people.
Follow us on social media
Explore how to treat and manage Seasonal Affective Disorder (SAD) with Best Life’s mood tracker, integrating weather data for holistic mental health

Discover the benefits of mindfulness around Thanksgiving with Best Life, the ultimate mindfulness app. Learn how to reduce holiday stress, enhance relationships,
More often than not, personal diary apps are using user data for their own profits. We don’t do that here. It’s why Best Life is built and managed by a nonprofit. Help keep data private, secure, and in the hands of the users who create it. Donate today.
If the form above does not appear, please visit this page.
