Best Life is the only heart health app that includes your environment! Track heart health, sync with trackers, log medication, see weather, air and pollen.
#1 heart health app with the most data
Best Life, the heart health app that has it all
Track heart rate, symptoms, medication and diet, sync with smart trackers, and more.
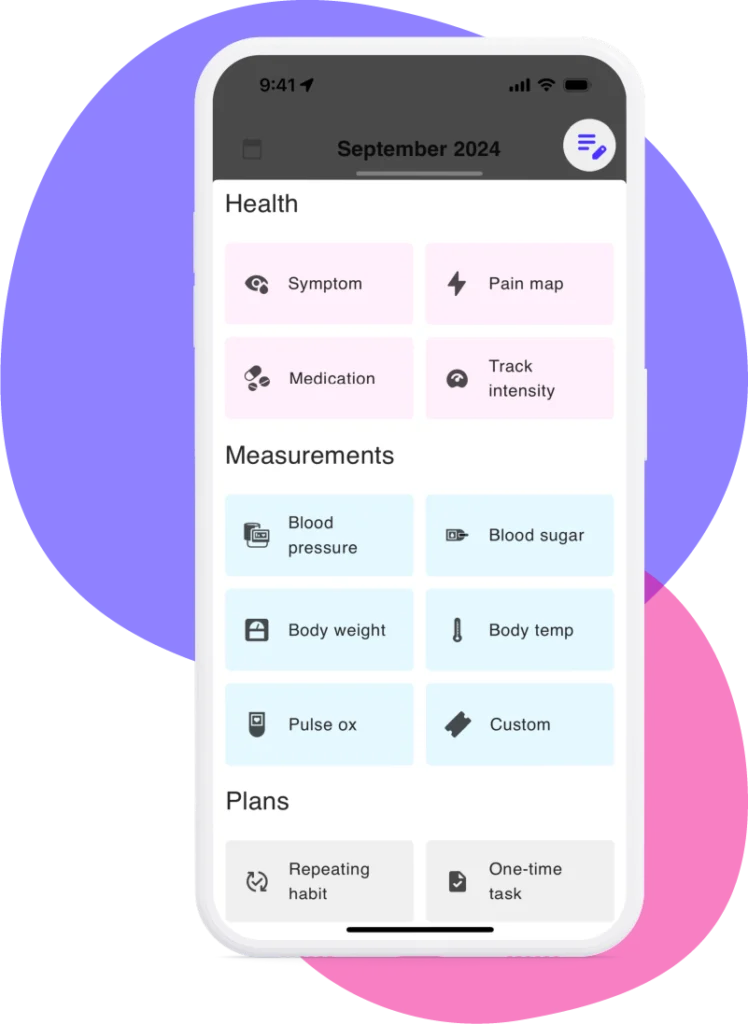
Health
Sync with health trackers like Google, Apple, and Fitbit.
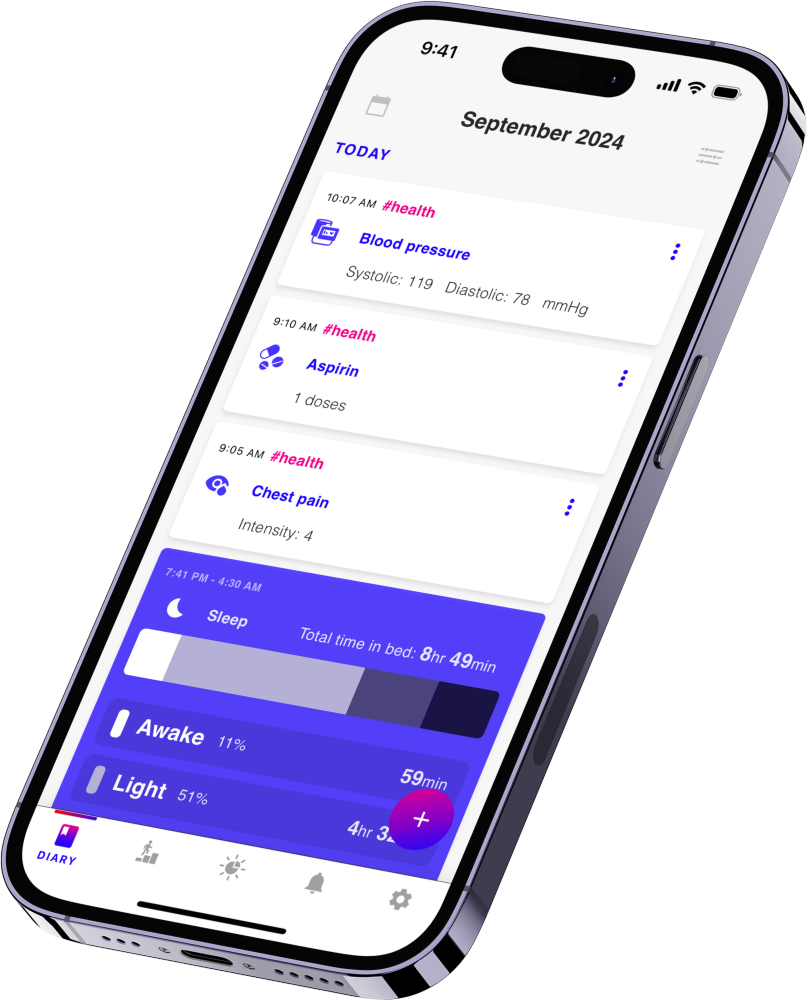
Journal + Log
Track anything from medication and nutrition to exercise.
Environment
See in data how weather, air quality, and pollen impact you.
Stress
Log stress from physical, intellectual, and social activity.
Moods
Track moods using an easy one to five scale.
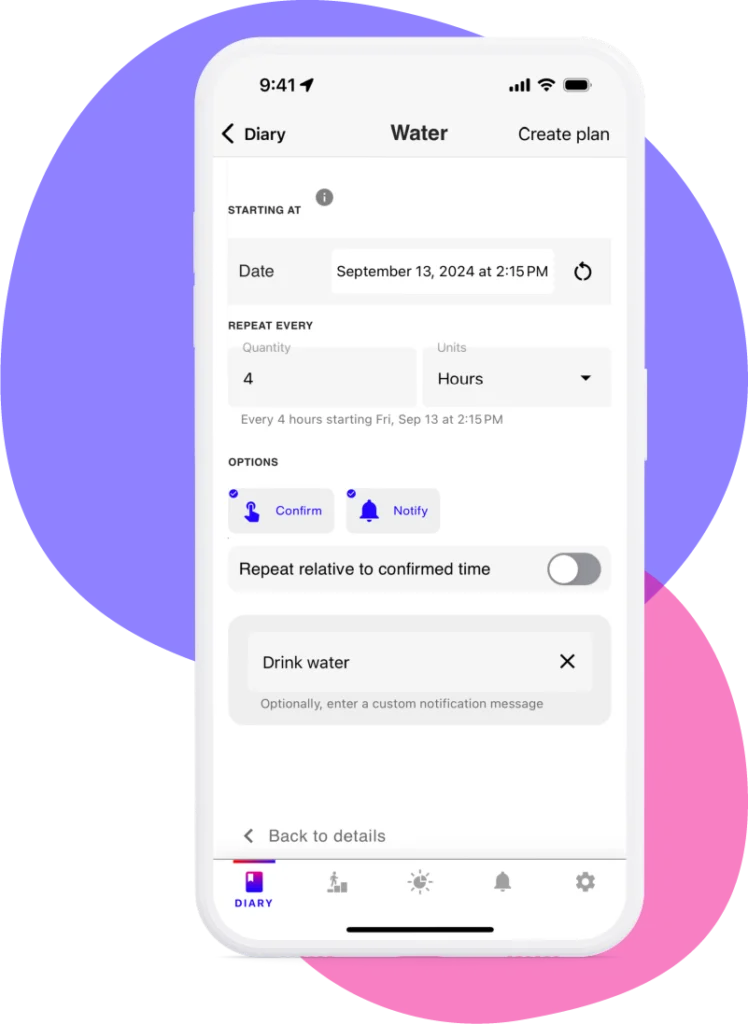
Reminders
Set reminders for just about anything.
Get more from your heart health app
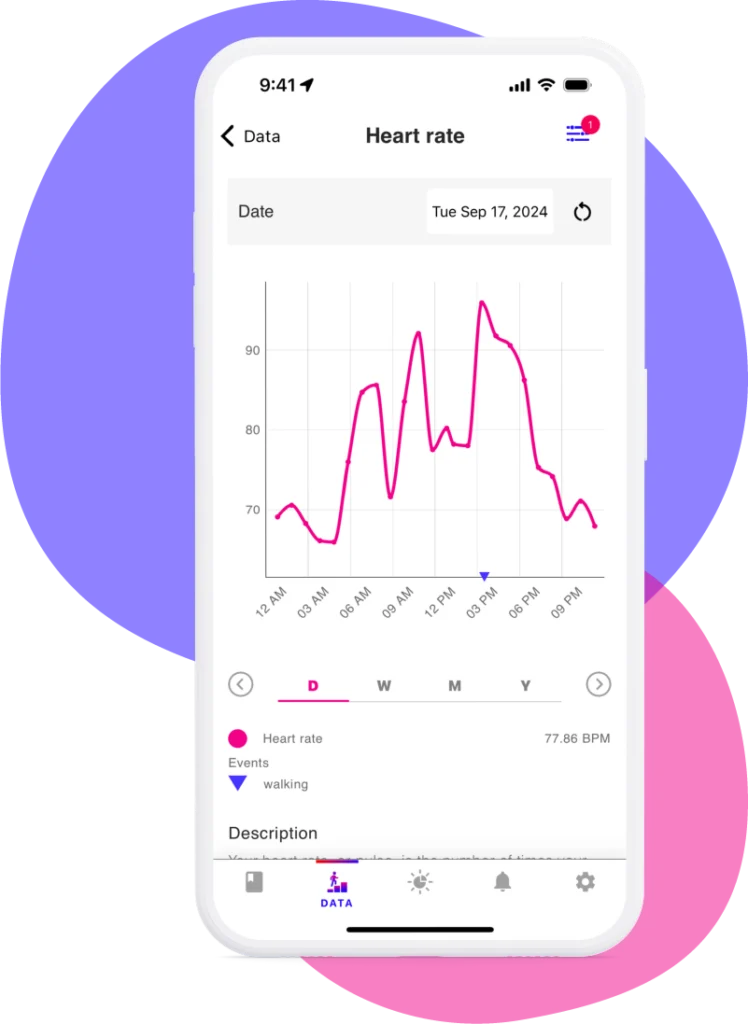
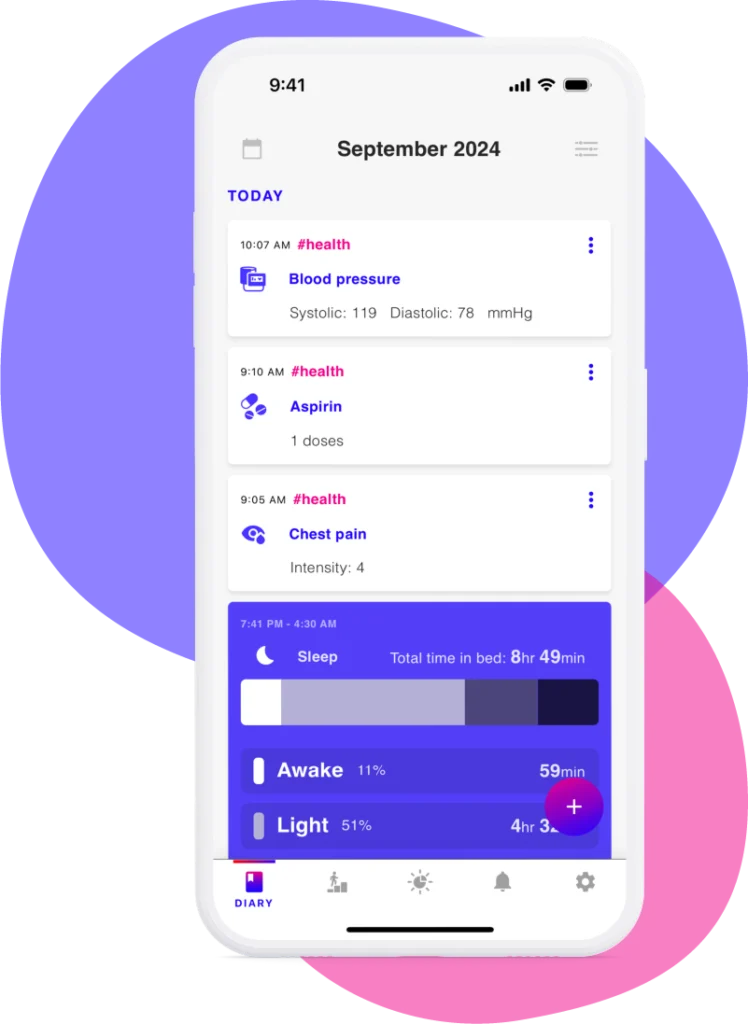
See heart rate alongside other data
Track activity, symptoms, nutrition, and medication using a flexible interface. Sync your other health data from Google and Apple to see it all in one place.
A heart health app without medical upsells
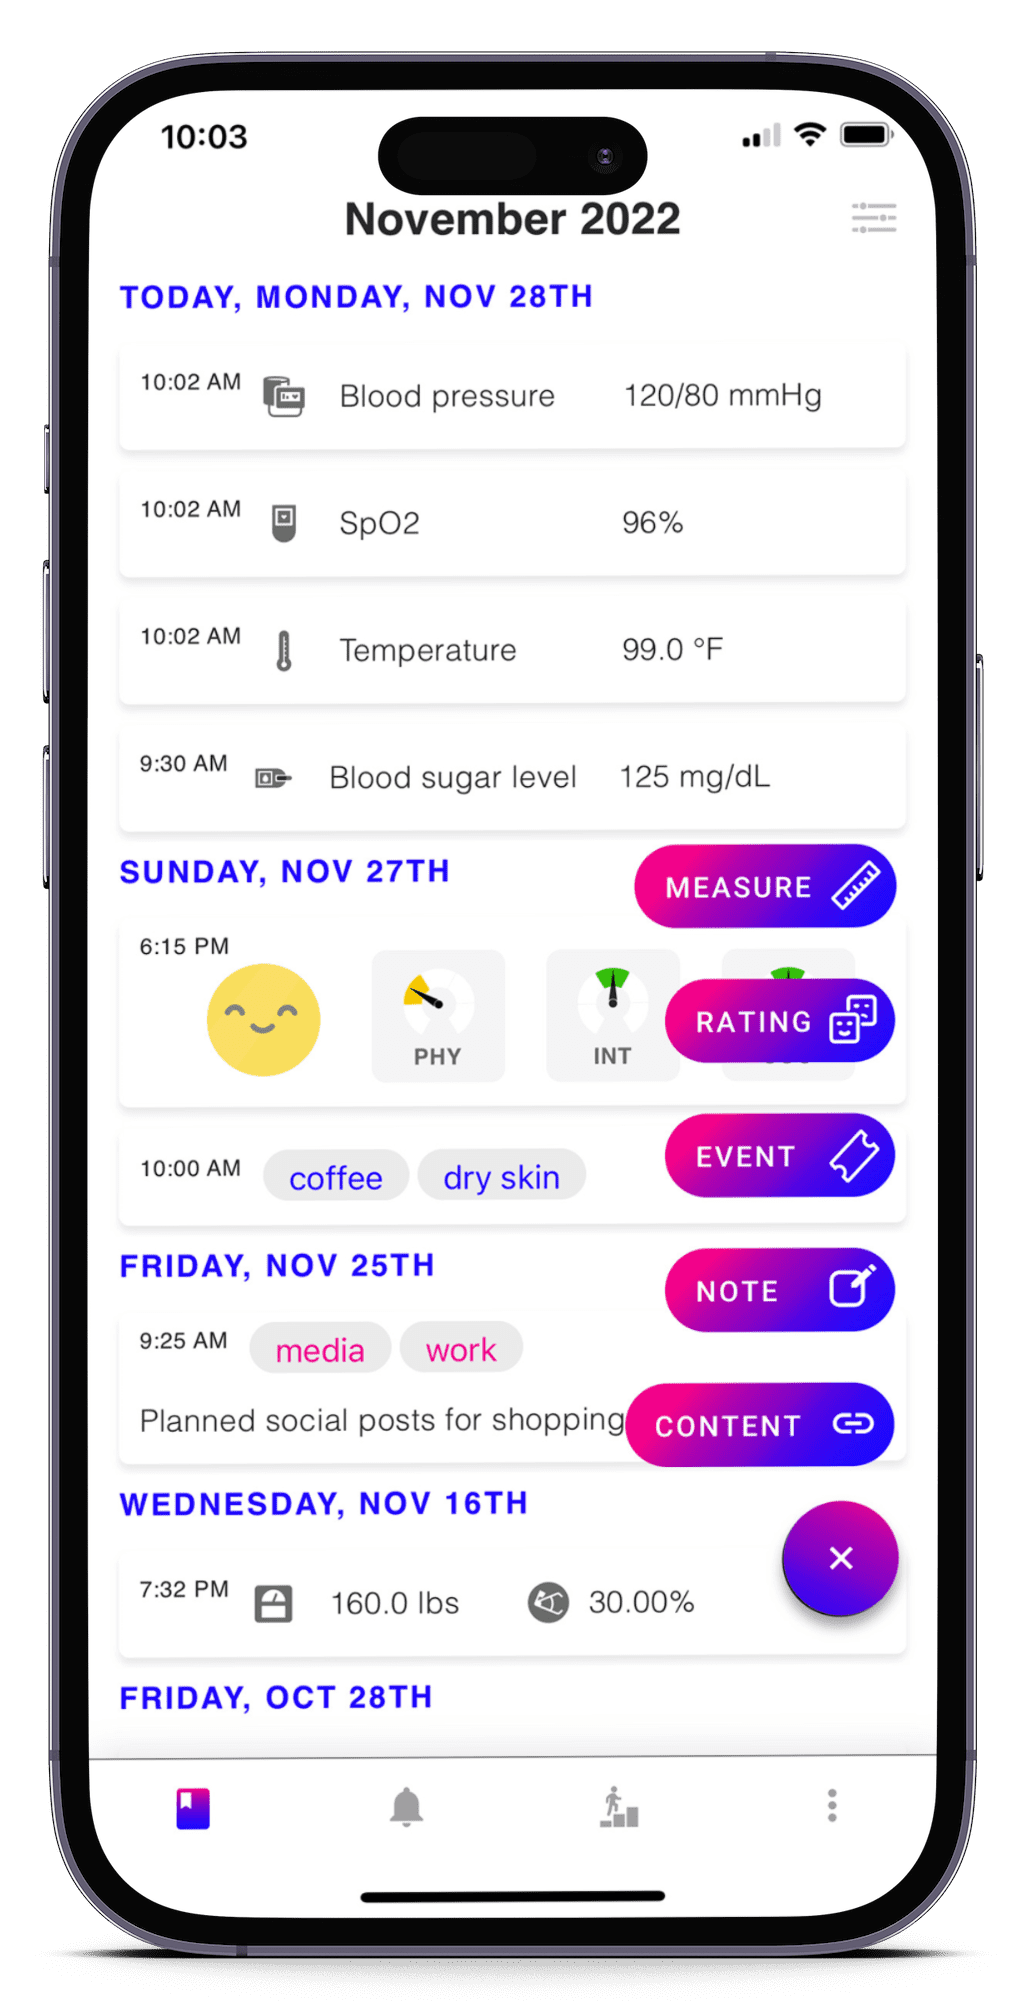
Compare data to visualize health impacts
Use the only heart health app that includes all your health data from vitals to activity, plus medication and custom tracking.
A helpful and flexible heart health app
Set reminders to achieve goals
Track activity, stress, and symptoms together to identify triggers or areas to improve. Set flexible reminders to meet new goals.
Secure your data in a single place
Best Life is the all-in-one heart health app
Track heart health, activity, symptoms and medications, sync with health trackers, compare to your other data.
See life differently.
Users on the journey to their Best Life
Join our happy users today
I love this app. It's helping me and a group of friends personalize various things to track. Nothing is as flexible. It's a dream come true. Just trying to figure out how we can share our results with each other.
This is great— this combines the features of several different health apps and puts it into one. Love being able to add symptoms, see my mood and stress graphs, and see the environmental factors around me!
It takes a lot to build mobile apps and if you're in any type of SaaS you know of the effort that goes into maintenance and improvements. They try with this app and it's quickly becoming my go to personal journal and health tracker app. I can't believe what we are missing from the native health apps as normal users. This is groundbreaking stuff.
My son and I are using Best Life to take care of his grandmother (my mother). It’s been a tremendous help to coordinate her care between us so we know when she got meds, when she eats, and taking notes with instructions from nurses.
I love Best Life on my iPhone and it's great that I can add Notes on my Mac as well! Great for my symptom tracking and allergies