No, Smart Watches and Rings Can’t Really Measure Blood Sugar
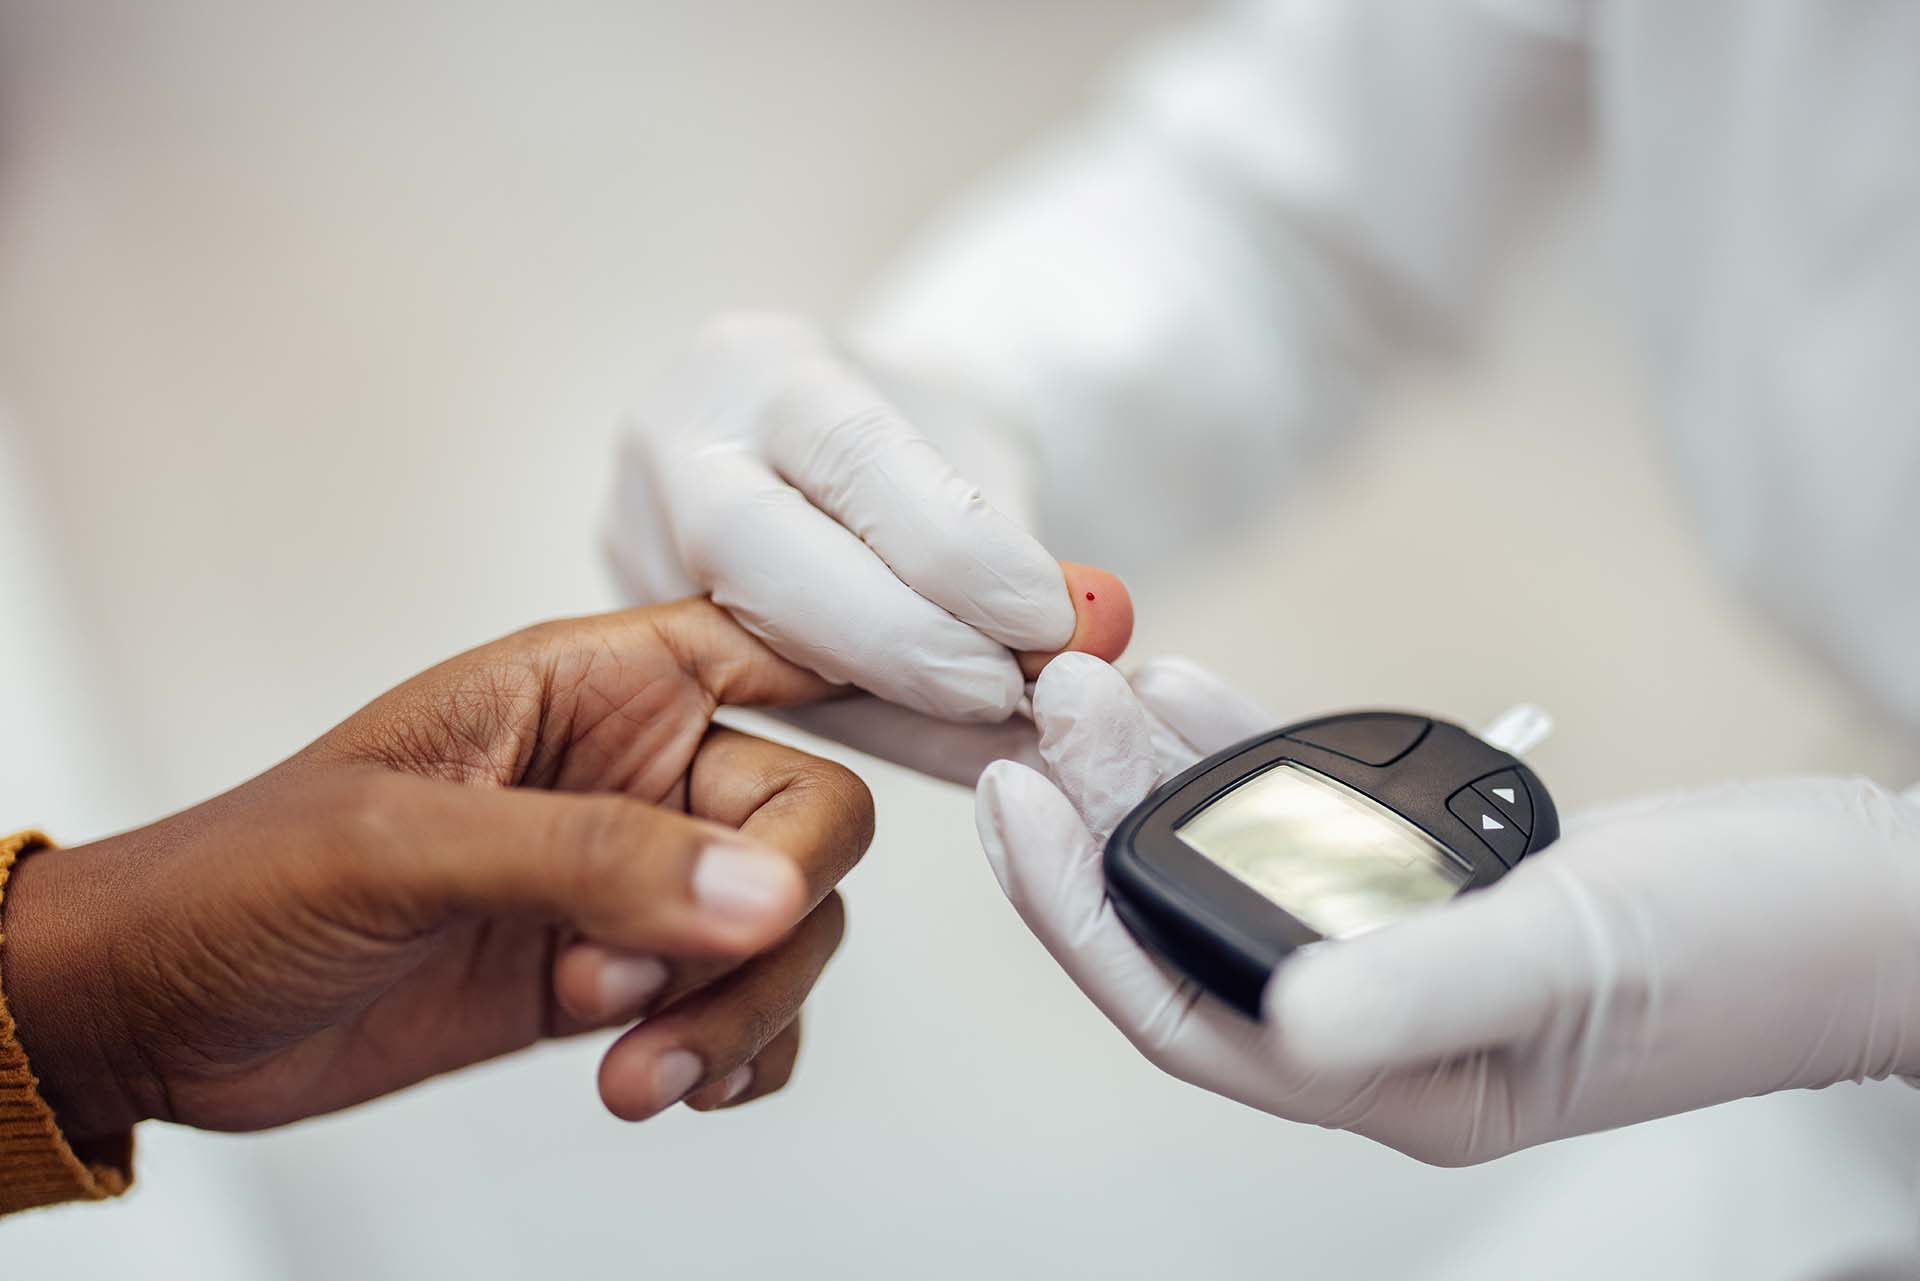
Smart watches and fitness trackers like Apple Watch, Oura Ring, and Fitbit cannot directly measure blood sugar levels, despite many users believing
Use Best Life as your migraine and headache app for tracking symptoms to learn triggers in as little as a month. Best Life is the migraine and headache app that includes environmental data, daily monitoring, and a symptom journal.
With Best Life you can see your local environment, symptom log, fitness data, health tracker info, and other data in visuals that make sense.
Learn what leads to your headaches, increase your quality of life, achieve your health goals, detect chronic conditions, and more using this migraine and headache app.
1 in 4 households have someone living with migraines.
Learning your triggers with Best Life can help you proactively treat and prevent headaches and migraines.
Supporting data from these providers
If you’ve ever struggled to manage migraines and headaches, then you know how tough it can be. That’s why we built Best Life, a daily diary for health management designed to help you make sense of your symptoms, custom for who you are as a unique individual.
Use Best Life as your headache app to see what headaches hit. During storms? What about during high humidity? Only when you’re at your parents? You will soon know for yourself.
With the ability to get environmental data based on where you are—even when you travel—you’ll be able to track and compare your health data from day to day easily. You’ll get tree, weed, or grass pollen count data, air quality, ozone, particulate matter, and more.
Best Life features location-based pollen count data, and symptom diary capabilities, and is completely secure and private.
So what are you waiting for?
It is easy to get lost in the daily grind. Take as much or as little time as you like to log your day. Build your own virtual space to focus on you, with measurable benefits.
Our Best Life app for headache tracking is the only data aggregation software available to include all data providers you use, giving you the big picture.
Easily share reliable, accurate data from your symptom logs, health monitors, and headache tracker to health providers for mental and physical check-ins, when you choose.
Can allergy season cause migraines?
Can allergy season cause headaches?
Can migraines cause seizures?
Can headaches mean something more serious?
Powered by the uniquely customizable Event log in Best Life, you uncover the hidden truth in your day-to-day.
Get pollen data based on where you are—even when you travel. You’ll be able to easily track and compare across your health data from day-to-day. Tree, weed, and grass pollen count data plus air quality, ozone, air particulate matter and more.
This is the best digital headache app that gives you the big picture of your digital life, daily habits, mental, and physical health.
Neurological-related symptoms become predictable and maybe even preventable. Could migraines be related to pregnancy? Does the season cause a headache, or is this something else? Can bad headaches trigger an epileptic attack?
Inspired by business intelligence methods, you can visualize all your data on top of your private logs and diary entries to learn for yourself.
Best Life will help you track your symptoms and health metrics to report on changes and trends. Get trend analysis alerts and notifications that let you know something has changed – good or bad.
Use the links on this page to download or open the Best Life app on the Google Play or Apple App Store. Then sign in using whatever account type you’re used to using.
We use a single sign-on (SSO) method of account creation to help cut down on risk and all those excess account logins you’ve likely got out there. We do this so you never have to remember yet another password.
Select a default timezone, and enable health data syncs and location info. Both of these are critical for someone looking to manage anything related to their heart health.
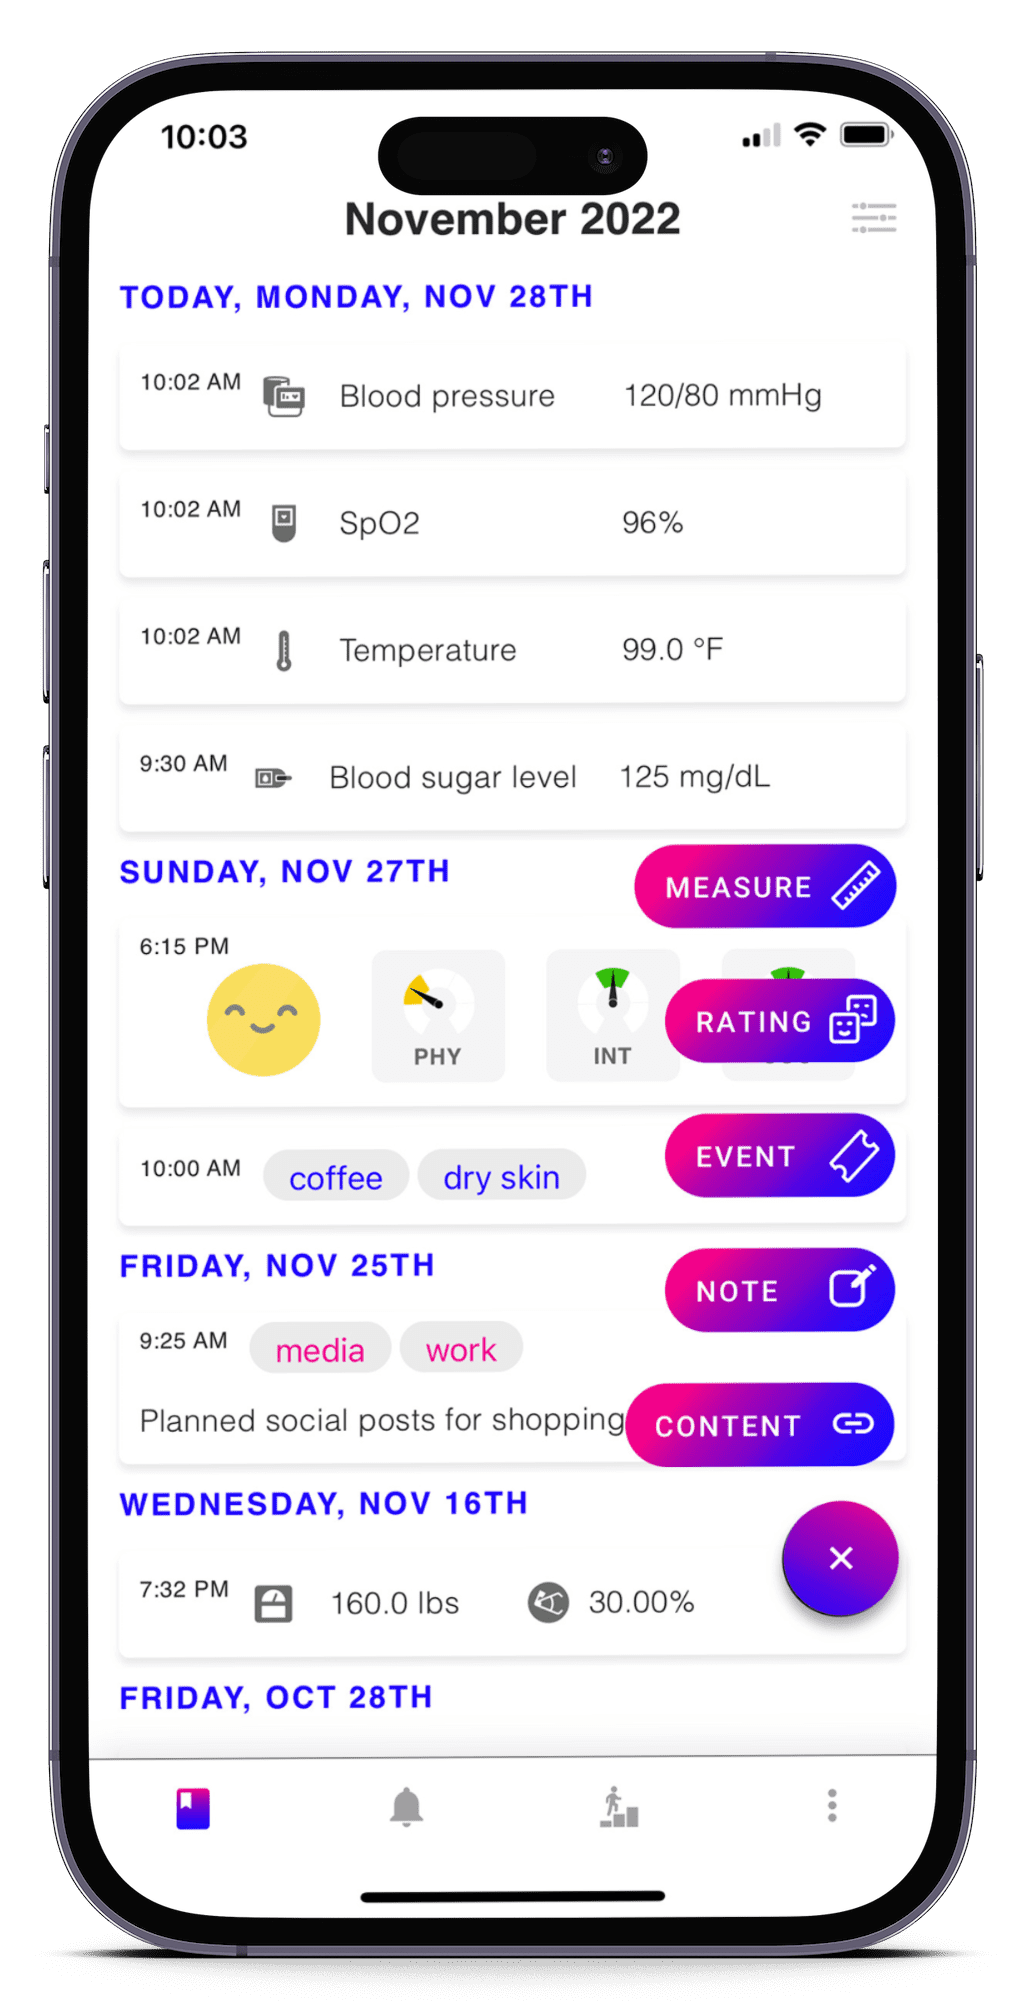
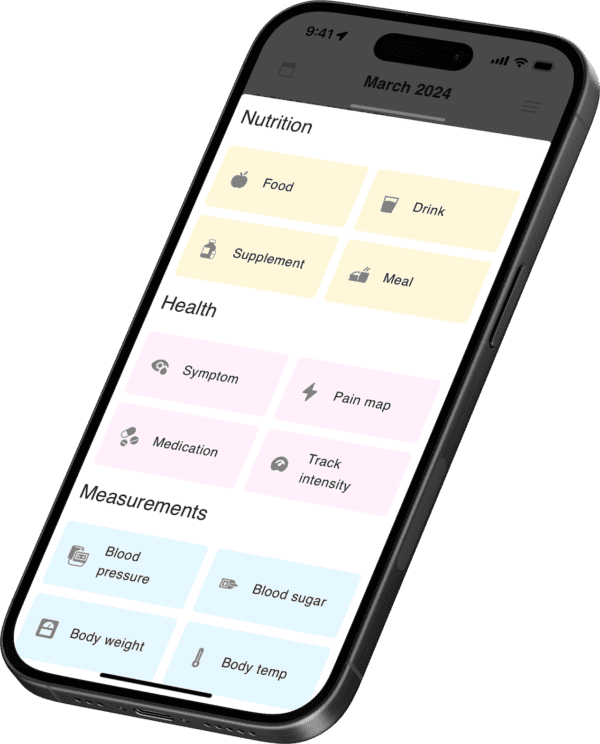
With all sorts of ways to add data to Best Life, you can add quick activity entries using Events and then elaborate on your day later in a Note.
Can allergies lead to headaches and migraines, or is my headache related to light and sound? Do migraines make you tired or cause fatigue? Can seasonal allergies lead to vertigo and feeling dizzy?
Combine your Best Life data with your health trackers for more accurate insight. See health data combined with your mood and stress ratings, habits, and just about anything else.
Best Life is a powerful tool for helping you take control of your life. Track data like what time of day you took you spent writing, then compare it to your environment, symptoms, and other data.
This helps you, your loved ones, and your doctors see a complete view if you choose to share it with them.
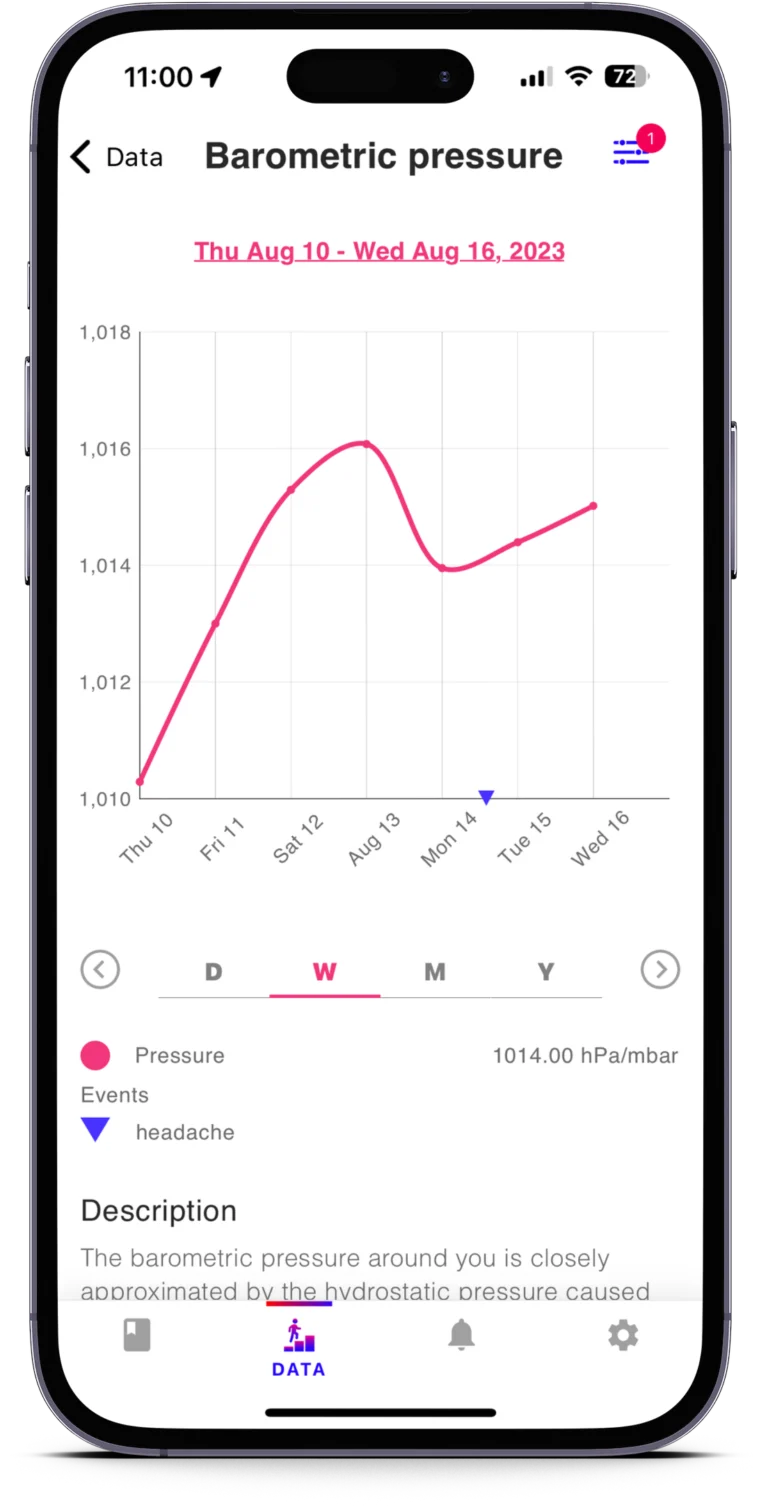
Discover new data trends, plot symptoms over weather graphs, and see your data like you never have before. Take your life by the data and demand the value return everyone deserves.
Our roadmap for headache app features
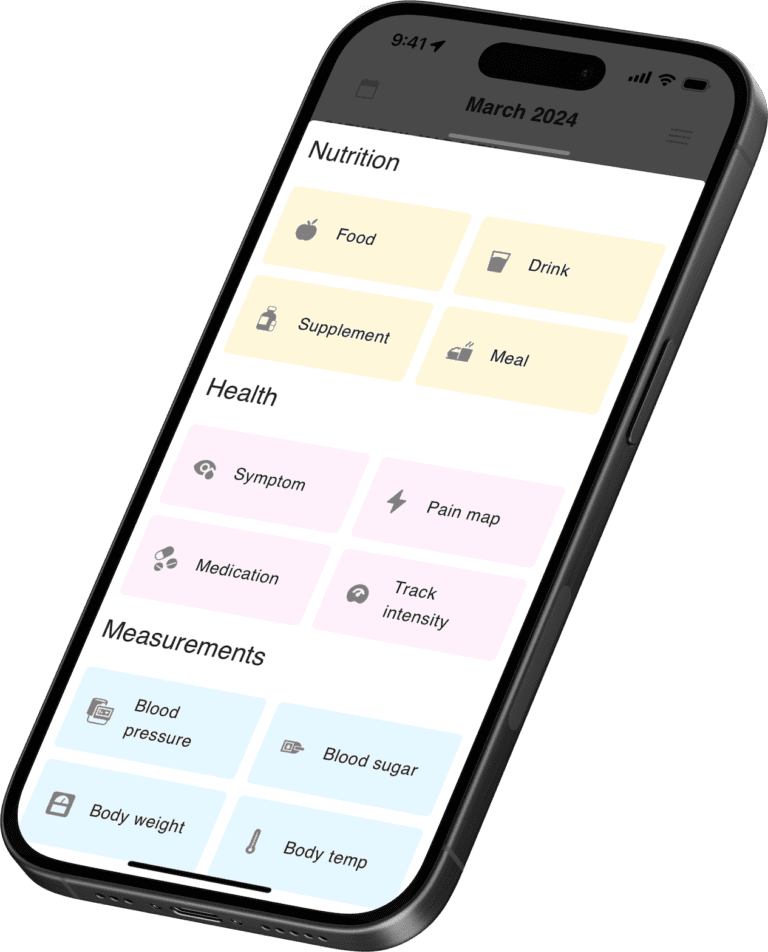
Using Best Life just for mood tracking? You can probably pass on this! However, if you live where it’s always sunny or rainy it could be helpful information.
The temperature, barometric pressure, humidity, and other factors definitely have an impact on your day to day.
Enabling location services lets your diary capture those daily differences.
Using Best Life just for journaling? You can probably pass on this!
Optional only! However, by syncing the Health data that your Apple Health kit or Google Fit already captured, you can see even more trends in your own data.
Once in your Diary, go ahead and tap the bottom menu icon for the little person on their data! Scroll to the Event count graph and tap into it.
In the top-right of each graph you will find the search and filter icon that opens a drawer with the ability to add specific Events on top of the data you’re reviewing.
Hit that awesome plus sign button on your Diary page once you’re in the app. From there, hit Rating and you’ll be able to add a mood rating.
You can also add stress ratings using the Goldilocks scale from this view.
In your list of graphs you will find the Mood and Stress graphs. The Mood graph will show you your daily, weekly, monthly, or annual average mood over time.
The Stress graph breaks into three variables (physical, social, intellectual) and plots those on an area chart using the same scales.
Let us know what data you want to see next by contacting our team online!
Want to see it even sooner though? Donate your time, effort, or contribute funds for our team to hire more software engineers.
Every dollar is a great addition to bringing data rights back to people.
Show your support by following us on social media

Smart watches and fitness trackers like Apple Watch, Oura Ring, and Fitbit cannot directly measure blood sugar levels, despite many users believing

Weather and health interact in mysterious ways! Learn how your local environment impacts your health and well-being in this article and live
Predictive analytics leading to decision support will empower you and your community to avoid uninformed decisions, mitigate events with negative consequences, and promote situations with positive outcomes. Even small improvements in decision making have enormous benefits to physical health, mental health, financial savings, and so much more.
If the form above does not appear, please visit this page.
