


Allergies
Hello World — Come Get to Know Us
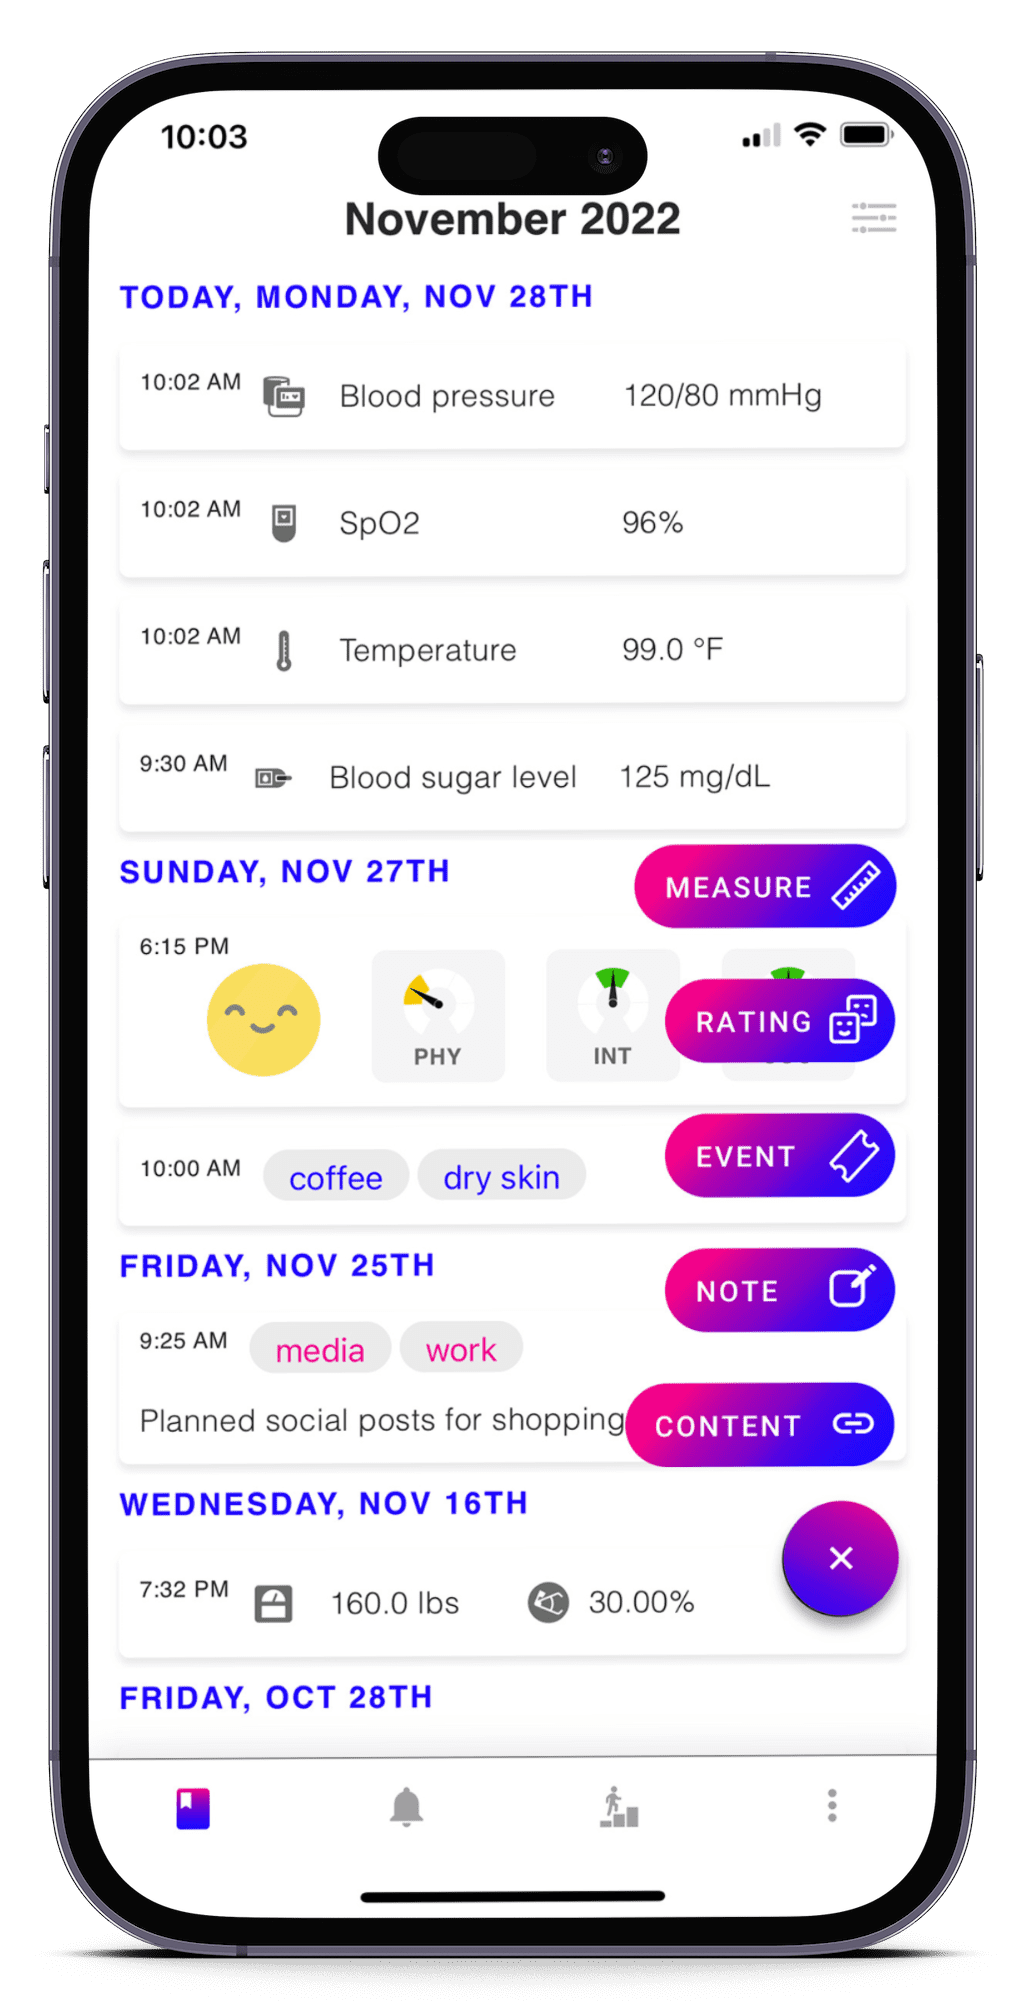
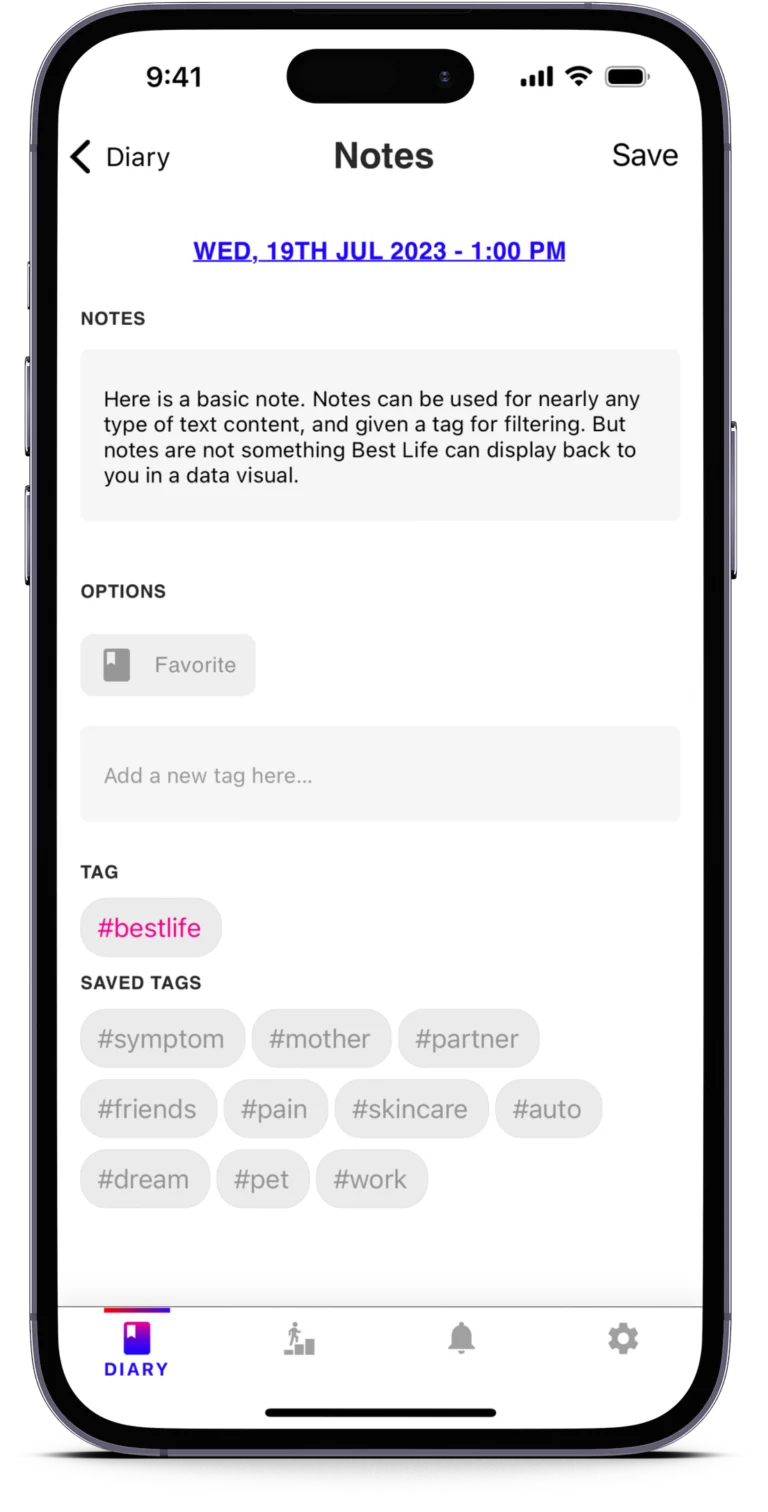
You don’t need another tracker—you need a partner.
Best Life turns simple daily logs into visible patterns that help you make better
Allergies
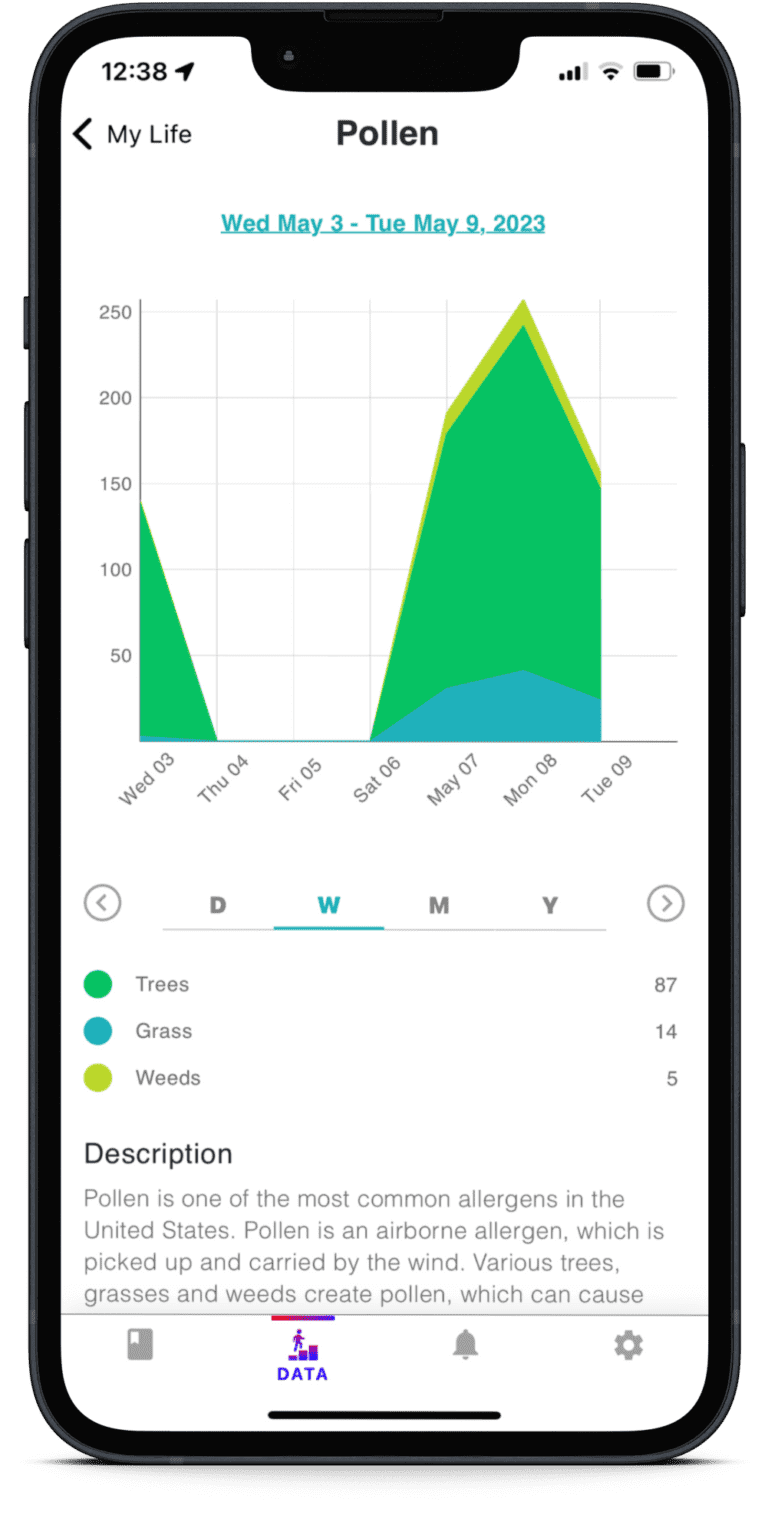
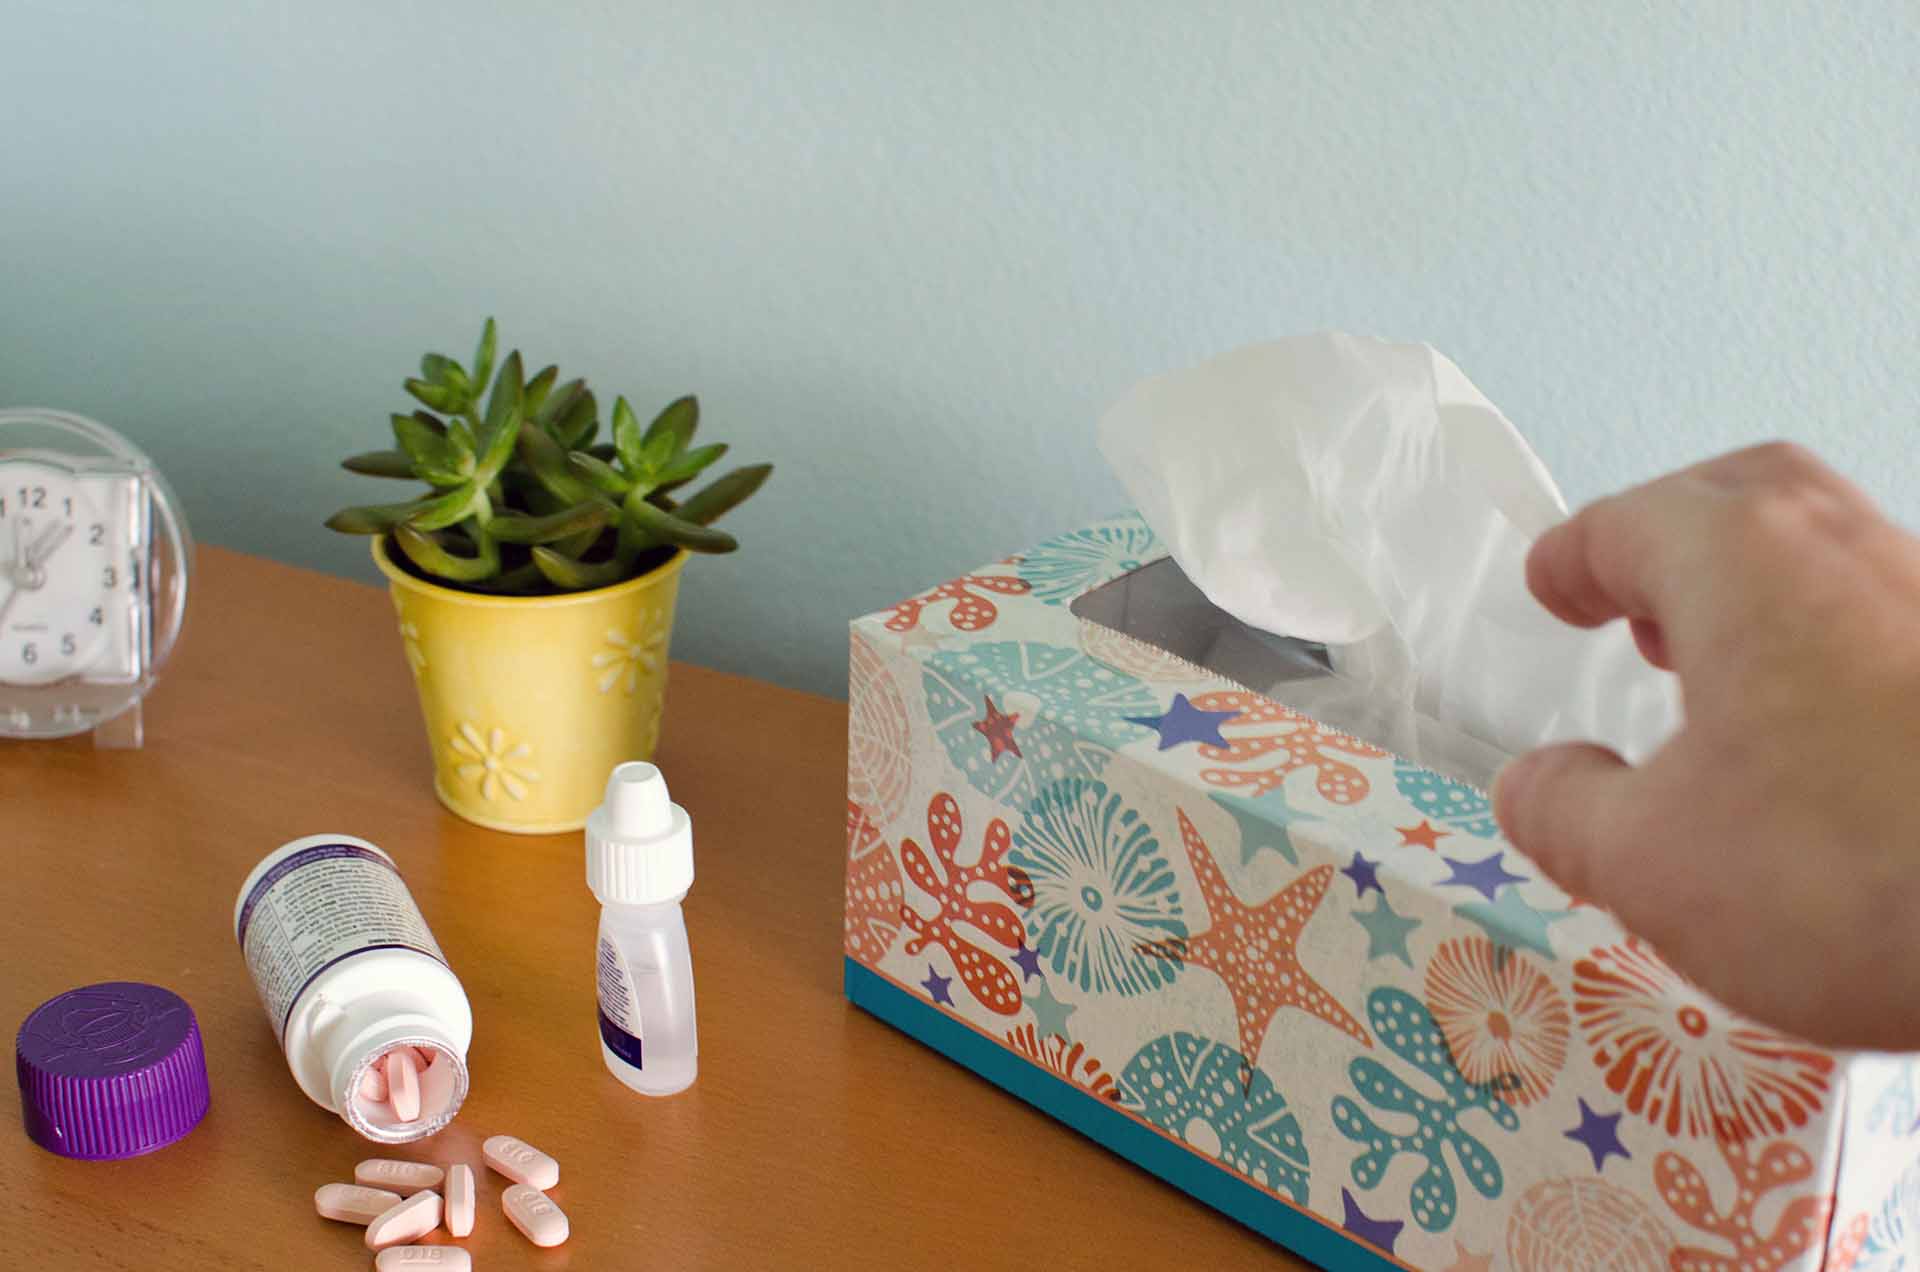
Tired of Sniffles & Sneezes? Defeat Seasonal Allergies with Data Insights
Every year, it’s the same – seasonal allergies wreak havoc on your daily life, negatively impacting well-being. Let’s fight back! Here’s how